LIBS Spectra of Elements
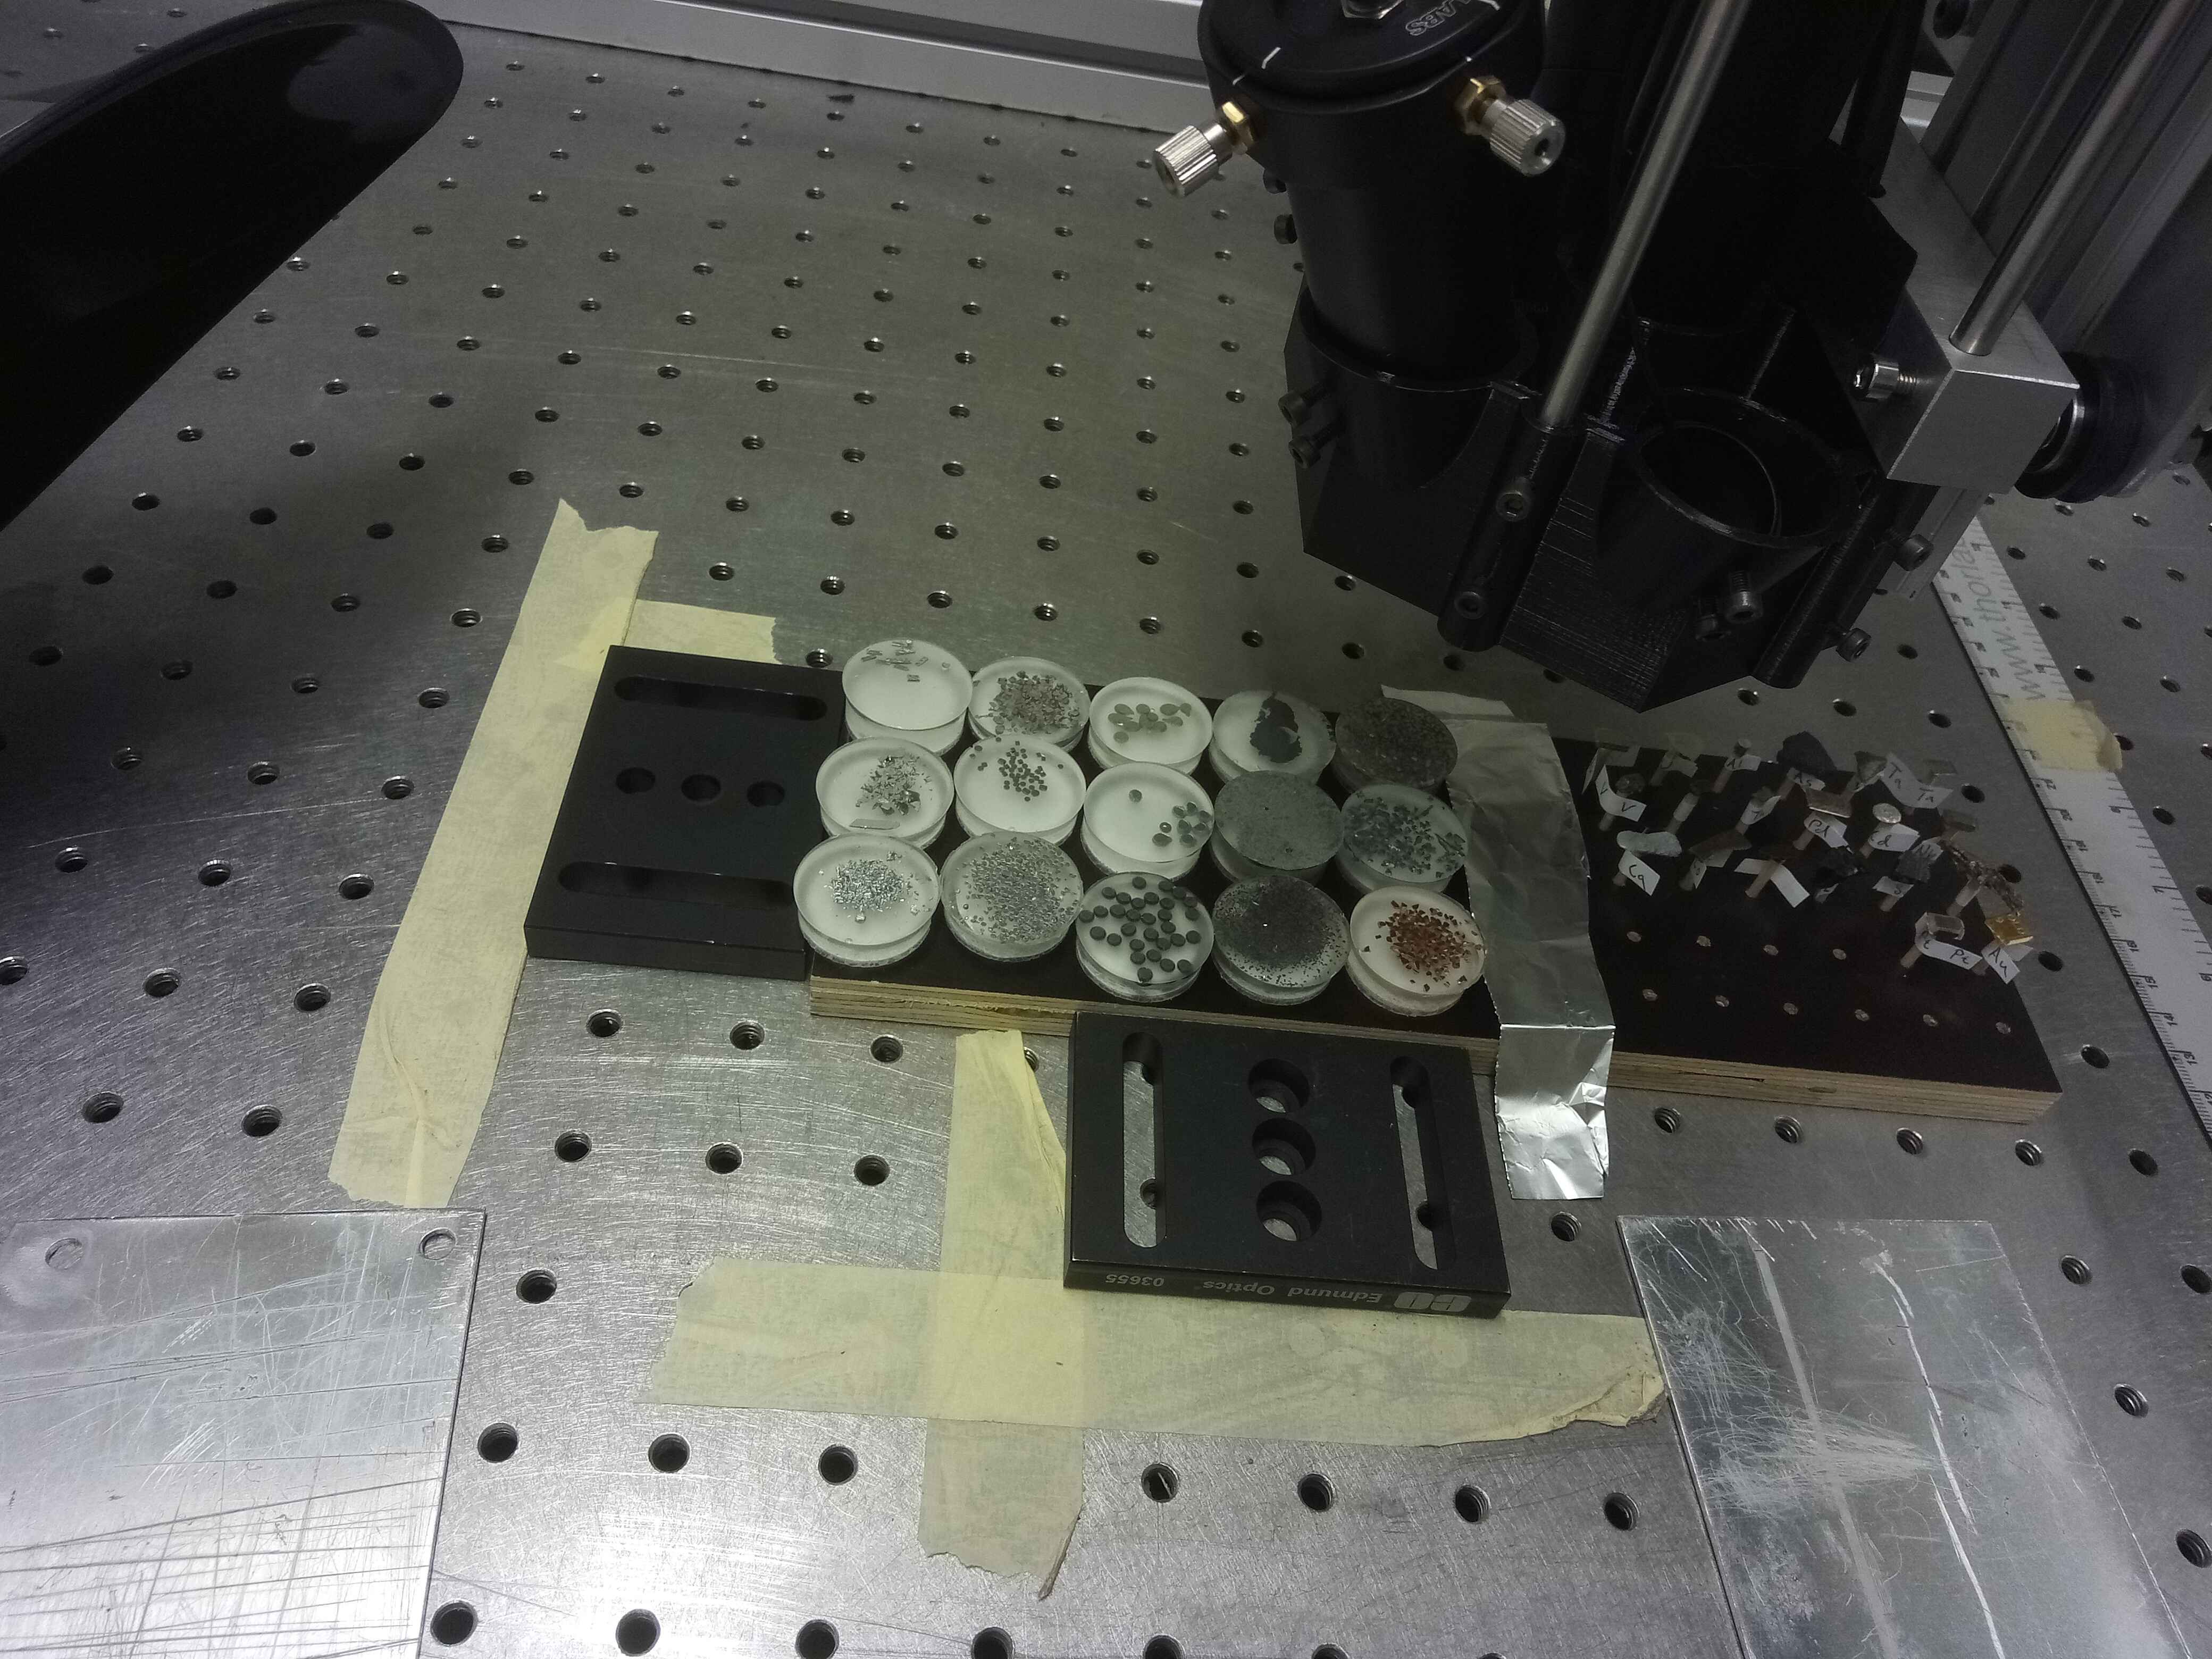
This page shows experimental LIBS spectra of many elements in the periodic table. Click a link on the element list or scroll down to the element you want to see. The experimental data comes either from pure element measurements or a reference material with well known constituents. For the experimental measurement setups, see the photo below and more on LASOLIBS page component listing for details. Spectra from different sources are marked with different colors with black for pure element, red for element filtered from multielement compound and green for theoretical spectrum. Theoretical spectra are given for all naturally occurring elements including those we don't have a good experimental measurement for.
Datas
To download the datasets for your own use, see LIBS datasets.
For LIBS spectra of minerals and other materials, see LIBS spectra of Minerals .
Other good elemental LIBS databases are AromTrace elements database, NIST LIBS Database.
Theoretical spectra
The theoretical spectra are built with atomic lines data data from Vienna Atomic Line Database(VALD), Kurucz database, and NIST Atomic Spectral Database ASD. Kramida, A., Ralchenko, Yu., Reader, J. and NIST ASD Team (2023). NIST Atomic Spectra Database (version 5.11), [Online]. Available: https://physics.nist.gov/asd. National Institute of Standards and Technology, Gaithersburg, MD. DOI: https://doi.org/10.18434/T4W30F and the equations and algorithms described at understanding LIBS spectrum page. For details about atomic line sources see atomic lines page and for details on modelling see modelling LIBS spectrum page
Elemental spectra
How are the spectra presented here
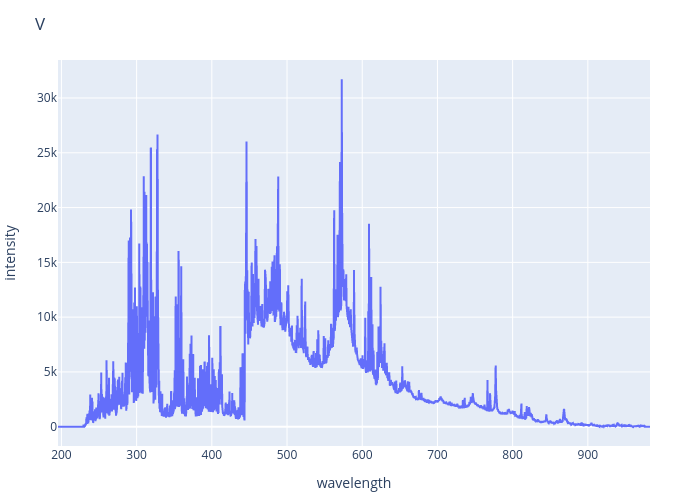
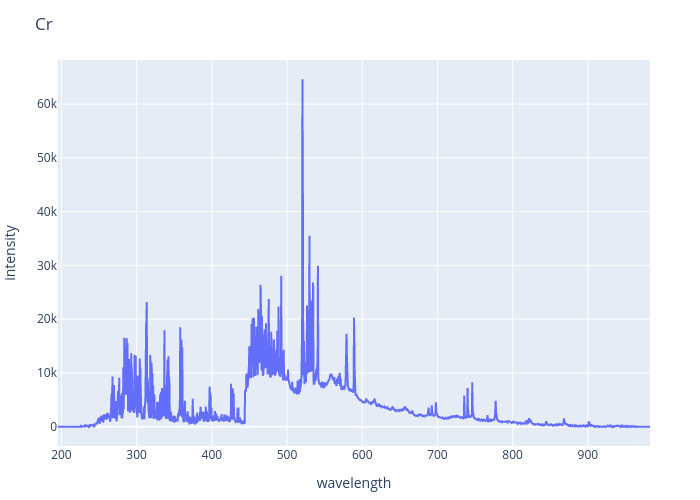
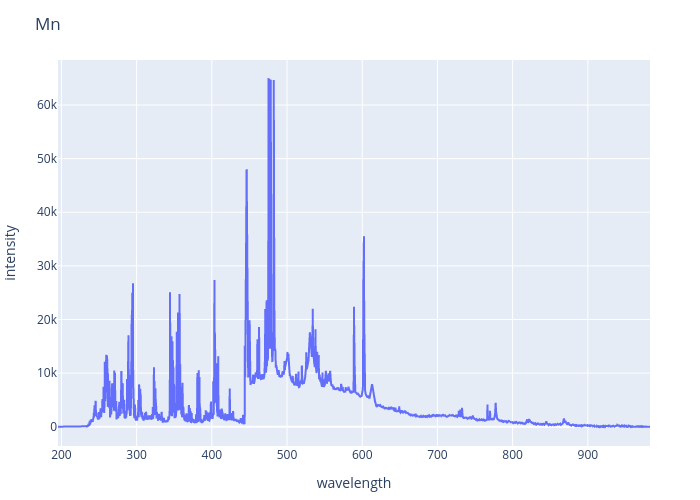
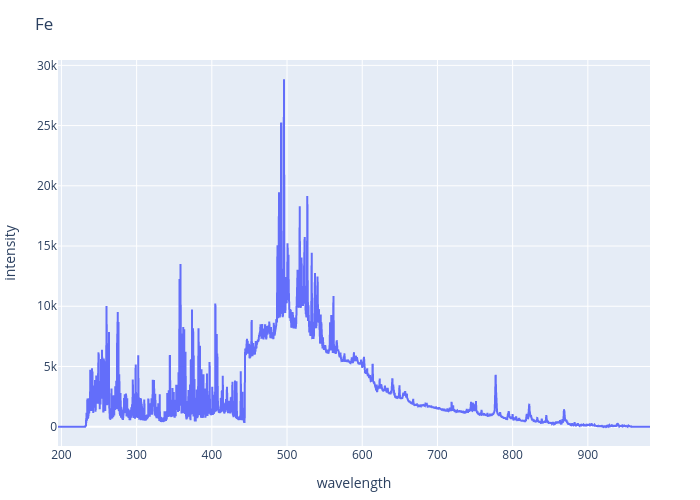
The experimental spectra shown here are a partially continuum-removed of a 90%-quantile calculated over multiple measurements shown in a logarithmic scale. Detailed calculation of this is shown in the elemental analysis notebook. Processed spectra are shown instead of raw measurement spectra is for better spotting of weak peaks and easier comparison between the spectra, but keep in mind these are as such not fully realistic spectra. You can click open any spectrum for alternatives or download the full dataset to access the real measurements at LIBS datasets.
1 H Hydrogen, 2 He Helium, 3 Li Lithium, 4 Be Beryllium, 5 B Boron, 6 C Carbon, 7 N Nitrogen, 8 O Oxygen, 9 F Fluorine, 10 Ne Neon, 11 Na Sodium, 12 Mg Magnesium, 13 Al Aluminium, 14 Si Silicon, 15 P Phosphorus, 16 S Sulphur, 17 Cl Chlorine, 18 Ar Argon, 19 K Potassium, 20 Ca Calcium, 21 Sc Scandium, 22 Ti Titanium, 23 V Vanadium, 24 Cr Chromium, 25 Mn Manganese, 26 Fe Iron, 27 Co Cobalt, 28 Ni Nickel, 29 Cu Copper, 30 Zn Zinc, 31 Ga Gallium, 32 Ge Germanium, 33 As Arsenic, 34 Se Selenium, 35 Br Bromine, 36 Kr Krypton, 37 Rb Rubidium, 38 Sr Strontium, 39 Y Yttrium, 40 Zr Zirconium, 41 Nb Niobium, 42 Mo Molybdenum, 43 Tc Technetium, 44 Ru Ruthenium, 45 Rh Rhodium, 46 Pd Palladium, 47 Ag Silver, 48 Cd Cadmium, 49 In Indium, 50 Sn Tin, 51 Sb Antimony, 52 Te Tellurium, 53 I Iodine, 54 Xe Xenon, 55 Cs Caesium, 56 Ba Barium, 57 La Lanthanum, 58 Ce Cerium, 59 Pr Praseodymium, 60 Nd Neodymium, 61 Pm Promethium, 62 Sm Samarium, 63 Eu Europium, 64 Gd Gadolinium, 65 Tb Terbium, 66 Dy Dysprosium, 67 Ho Holmium, 68 Er Erbium, 69 Tm Thulium, 70 Yb Ytterbium, 71 Lu Lutetium, 72 Hf Hafnium, 73 Ta Tantalum, 74 W Tungsten, 75 Re Rhenium, 76 Os Osmium, 77 Ir Iridium, 78 Pt Platinum, 79 Au Gold, 80 Hg Mercury, 81 Tl Thallium, 82 Pb Lead, 83 Bi Bismuth, 84 Po Polonium, 85 At Astatine, 86 Rn Radon, 87 Fr Francium, 88 Ra Radium, 89 Ac Actinium, 90 Th Thorium, 91 Pa Protactinium, 92 U Uranium, 93 Np Neptunium, 94 Pu Plutonium, 95 Am Americium, 96 Cm Curium, 97 Bk Berkelium, 98 Cf Californium, 99 Es Einsteinium, 100 Fm Fermium, 101 Md Mendelevium, 102 No Nobelium, 103 Lr Lawrencium, 104 Rf Rutherfordium, 105 Db Dubnium, 106 Sg Seaborgium, 107 Bh Bohrium, 108 Hs Hassium, 109 Mt Meitnerium, 110 Ds Darmstadtium, 111 Rg Roentgenium, 112 Cn Copernicium, 113 Nh Nihonium, 114 Fl Flerovium, 115 Mc Moscovium, 116 Lv Livermorium, 117 Ts Tennessine, 118 Og Oganesson
Note: Click on a spectrum to open an interactive version or to download single spectrum data!
1 H Hydrogen
2 He Helium
3 Li Lithium
4 Be Beryllium
5 B Boron
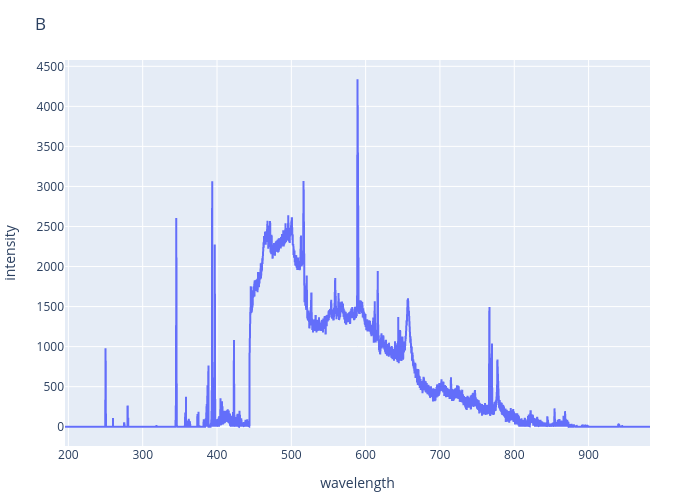
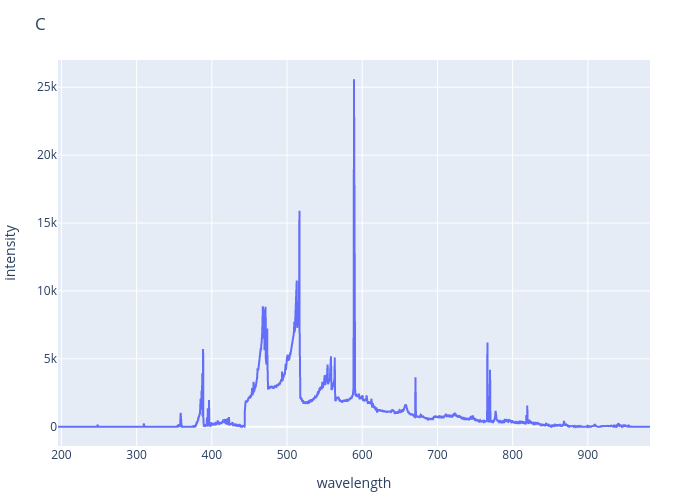
6 C Carbon
Carbon has C2 and CN molecular bands visible here.
7 N Nitrogen
8 O Oxygen
9 F Fluorine
10 Ne Neon
11 Na Sodium
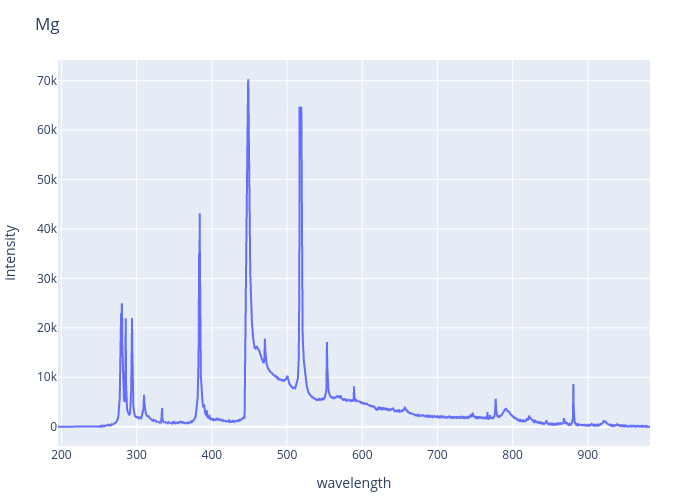
12 Mg Magnesium
13 Al Aluminium
Two samples for aluminium Aluminium sample 1 out of 2. 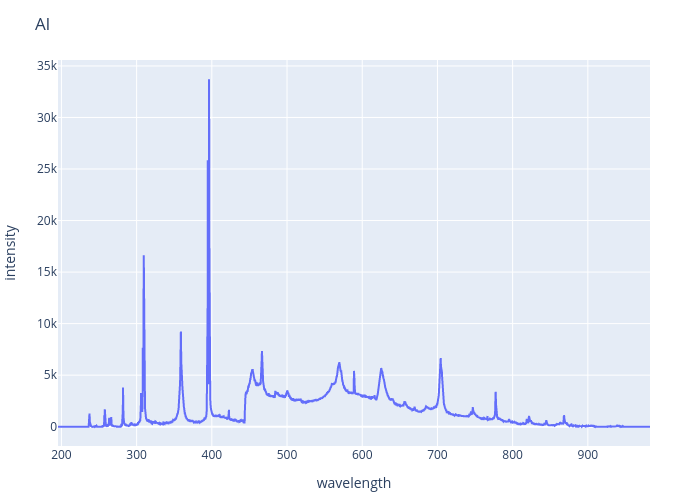
Aluminium sample 2 out of 2. There are small molecular AlO vibrations peaks visible around 480-520nm. 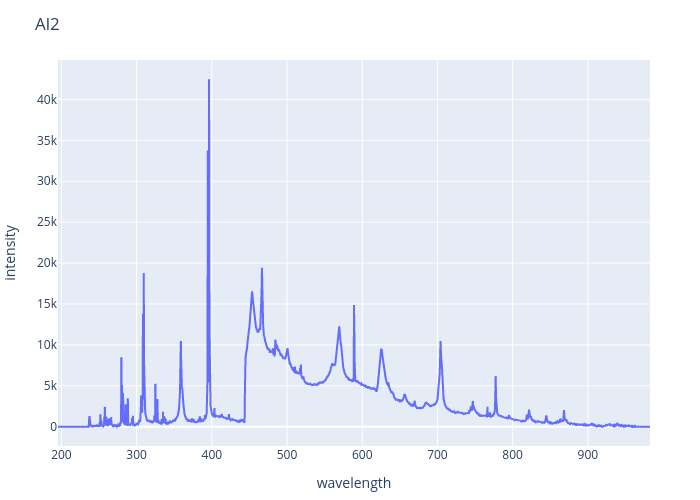
14 Si Silicon
15 P Phosphorus
16 S Sulphur
17 Cl Chlorine
18 Ar Argon
19 K Potassium
20 Ca Calcium
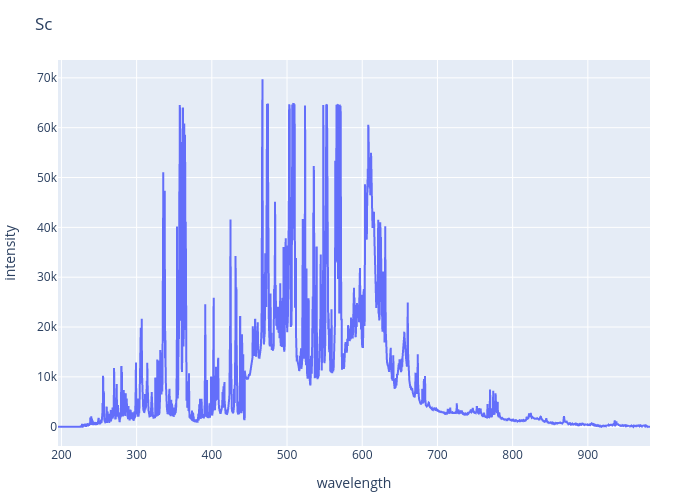
21 Sc Scandium
22 Ti Titanium
UV side(200-443nm) spectrometer was out of focus during measurement so the spectrum isn't good. Many peaks are still visible after rescaling. 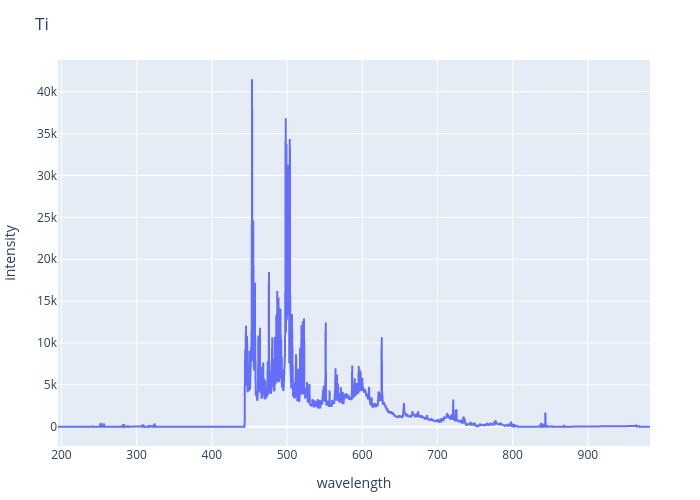
23 V Vanadium
24 Cr Chromium
25 Mn Manganese
26 Fe Iron
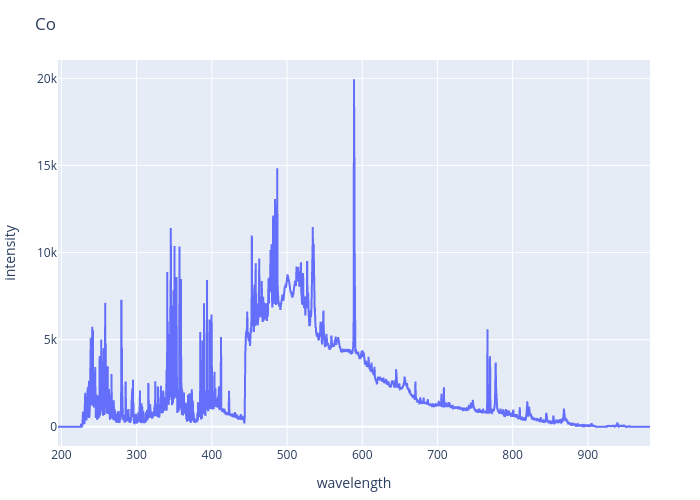
27 Co Cobalt
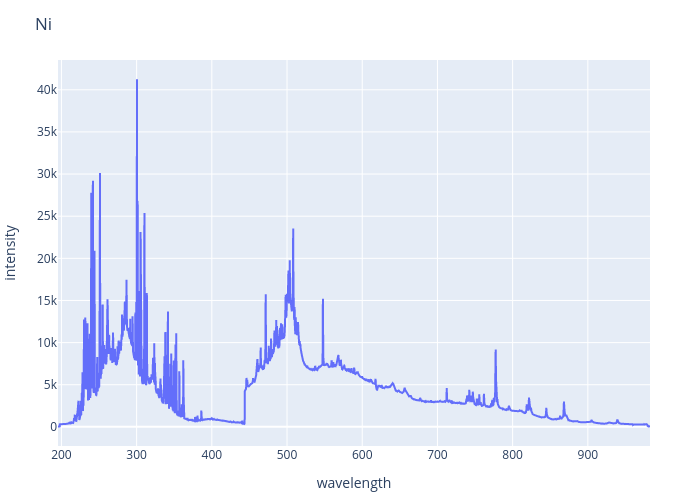
28 Ni Nickel
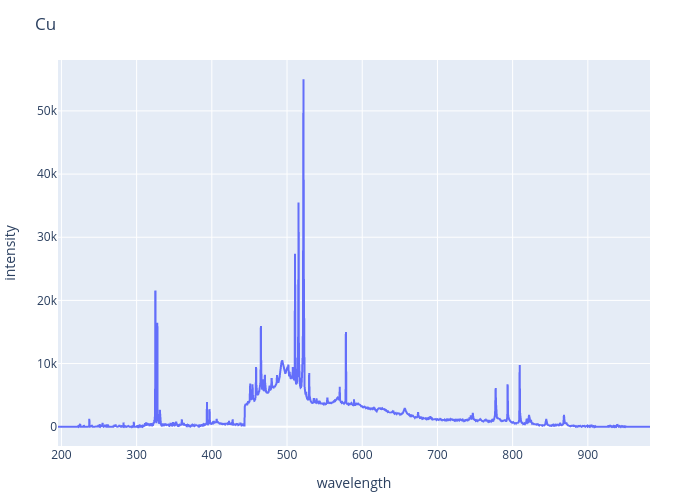
29 Cu Copper
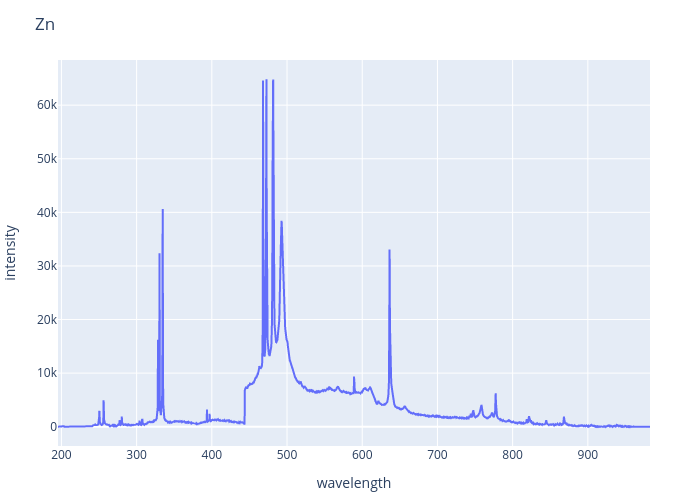
30 Zn Zinc
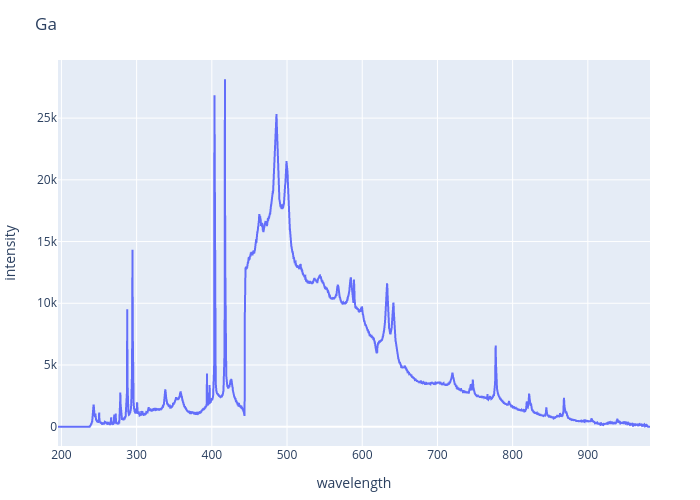
31 Ga Gallium
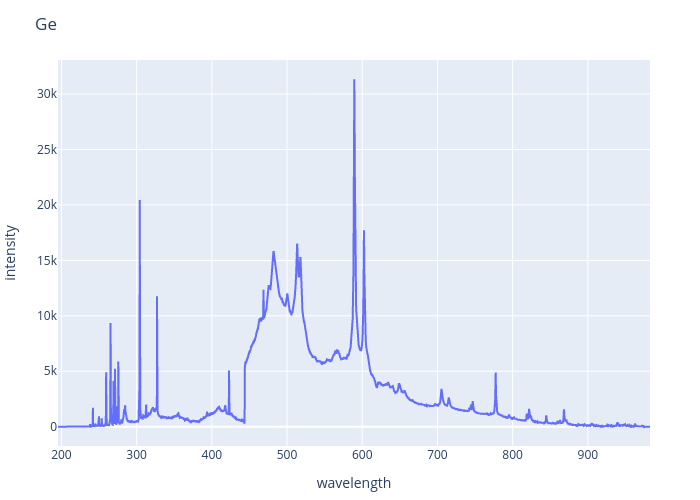
32 Ge Germanium
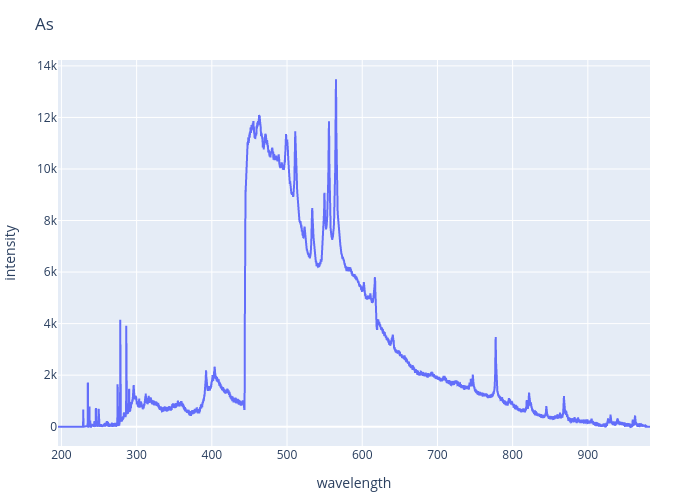
33 As Arsenic
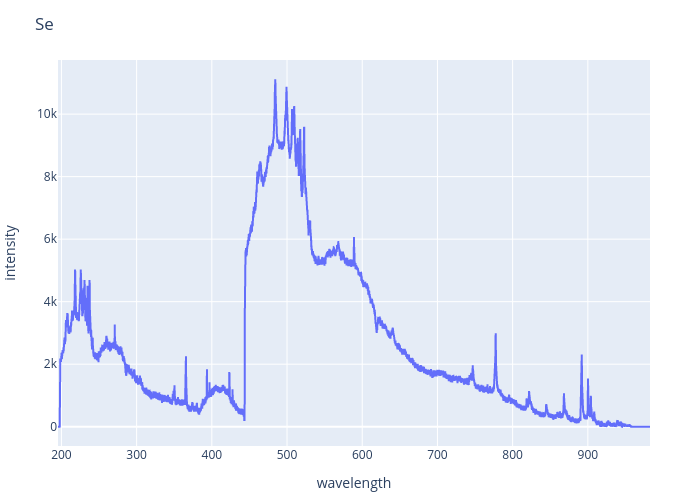
34 Se Selenium
35 Br Bromine
36 Kr Krypton
37 Rb Rubidium
38 Sr Strontium
39 Y Yttrium
Check also separate REE page. 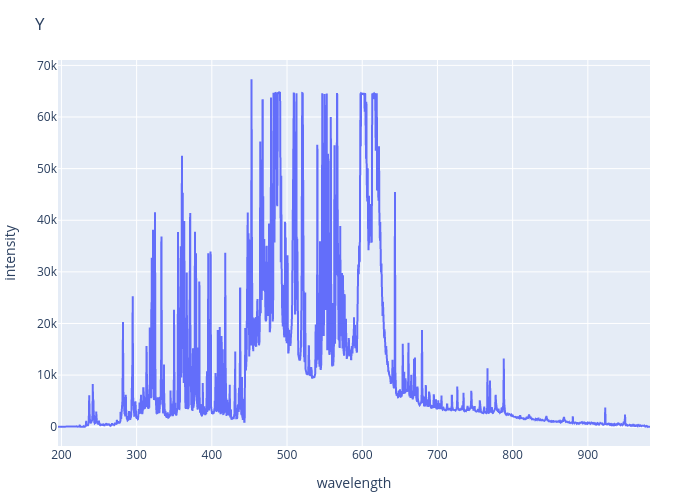
40 Zr Zirconium
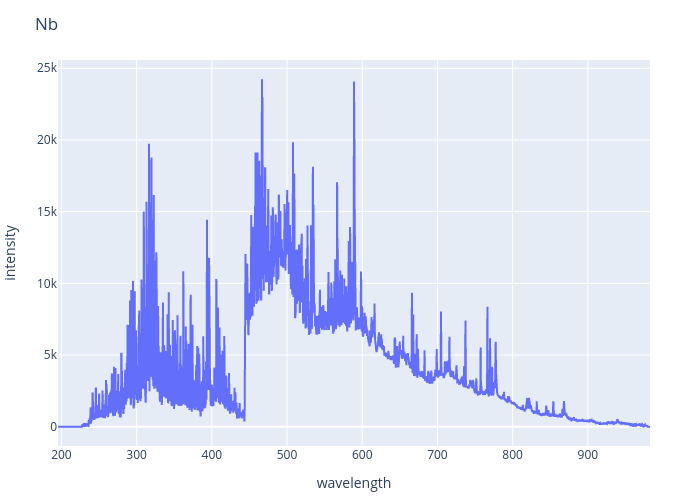
41 Nb Niobium
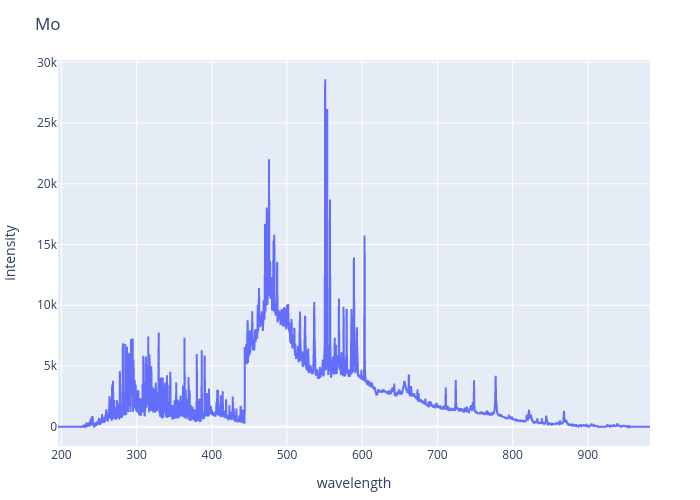
42 Mo Molybdenum
43 Tc Technetium
44 Ru Ruthenium
45 Rh Rhodium
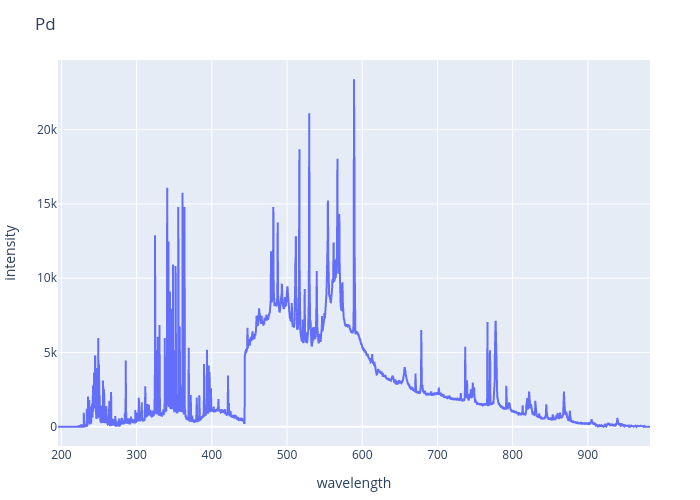
46 Pd Palladium
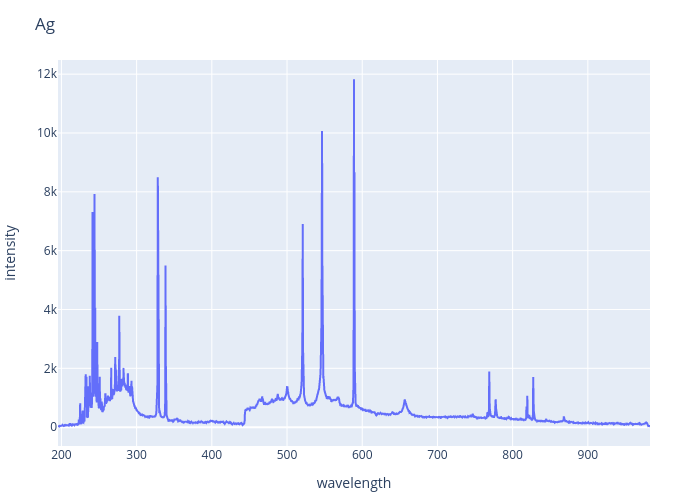
47 Ag Silver
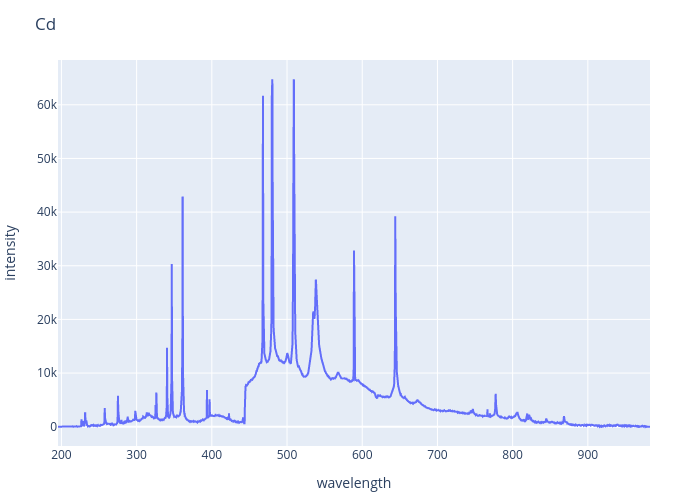
48 Cd Cadmium
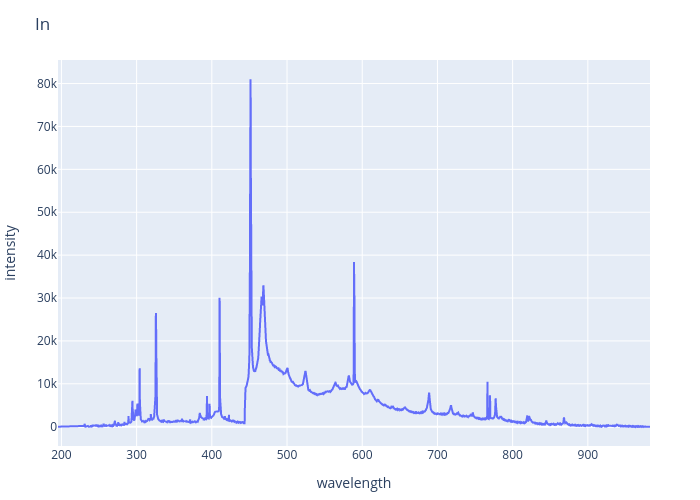
49 In Indium
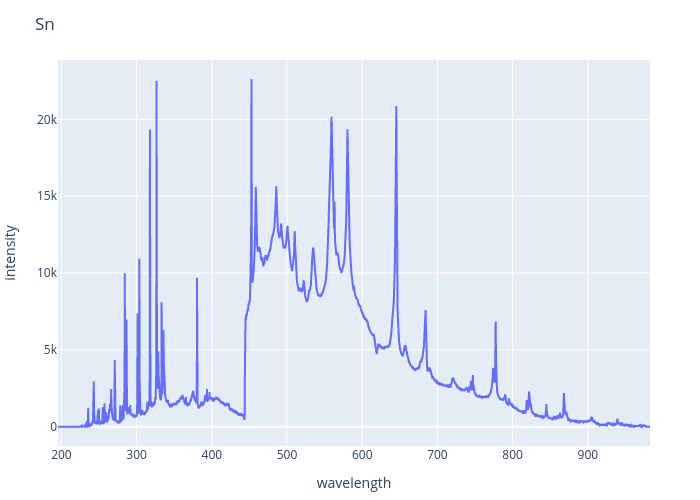
50 Sn Tin
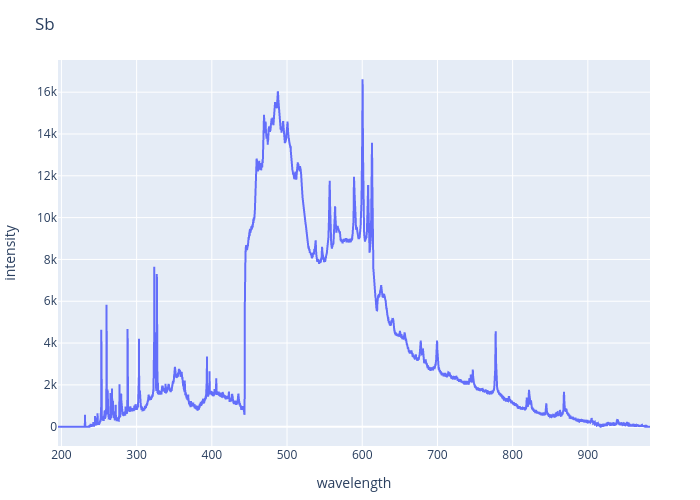
51 Sb Antimony
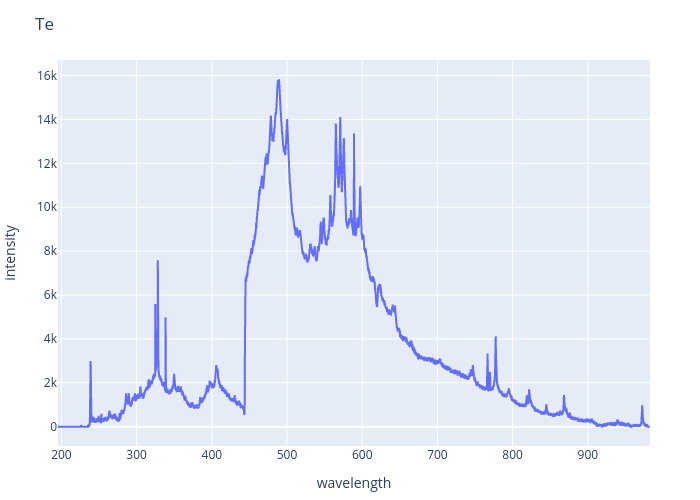
52 Te Tellurium
53 I Iodine
54 Xe Xenon
55 Cs Caesium
56 Ba Barium
57 La Lanthanum
Note: spectrum extracted from a glass melt i.e. this is not pure element measurement. Check separate REE page. 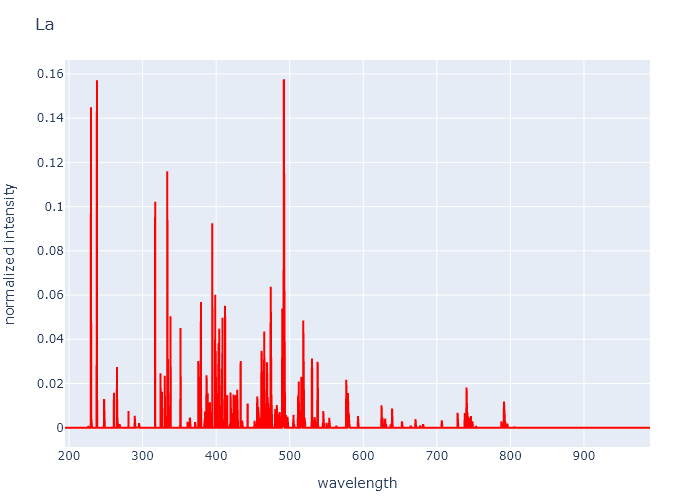
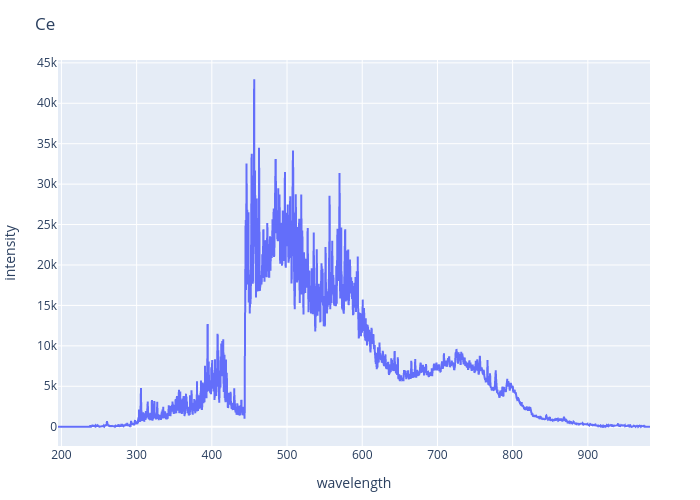
58 Ce Cerium
Note: spectrum extracted from a glass melt i.e. this is not pure element measurement. Check separate REE page. 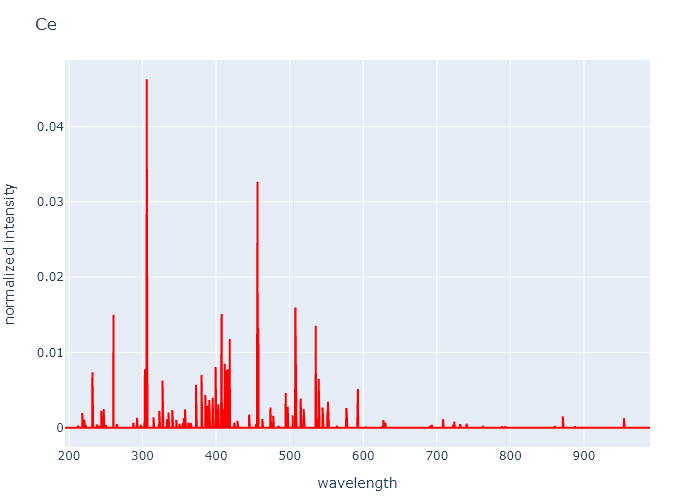
59 Pr Praseodymium
Note: spectrum extracted from a glass melt i.e. this is not pure element measurement. Check separate REE page. 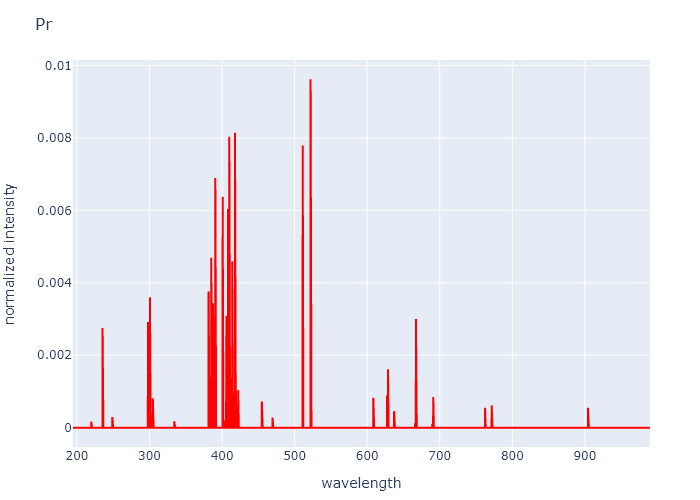
60 Nd Neodymium
Note: spectrum extracted from a glass melt i.e. this is not pure element measurement. Check separate REE page. 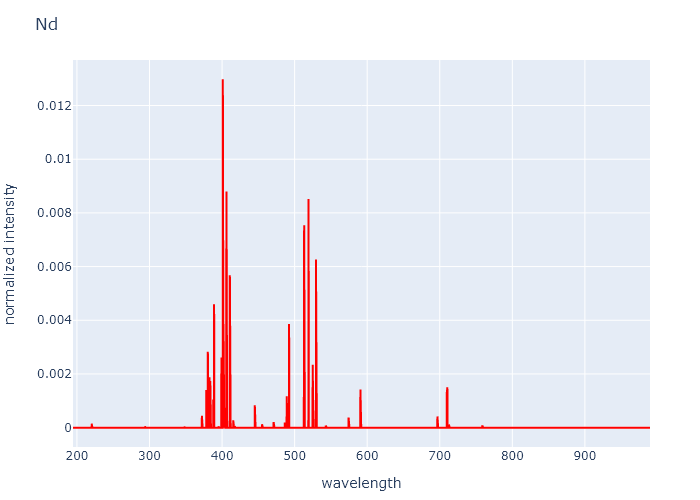
61 Pm Promethium
62 Sm Samarium
Note: spectrum extracted from a glass melt i.e. this is not pure element measurement. Check separate REE page. 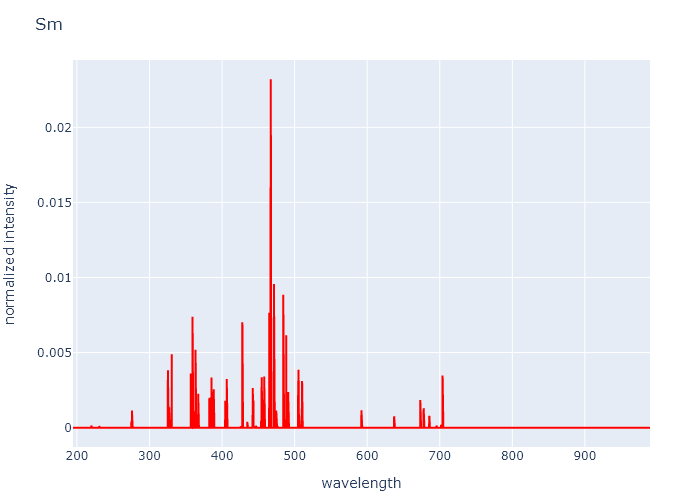
63 Eu Europium
Note: spectrum extracted from a glass melt i.e. this is not pure element measurement. Check separate REE page. 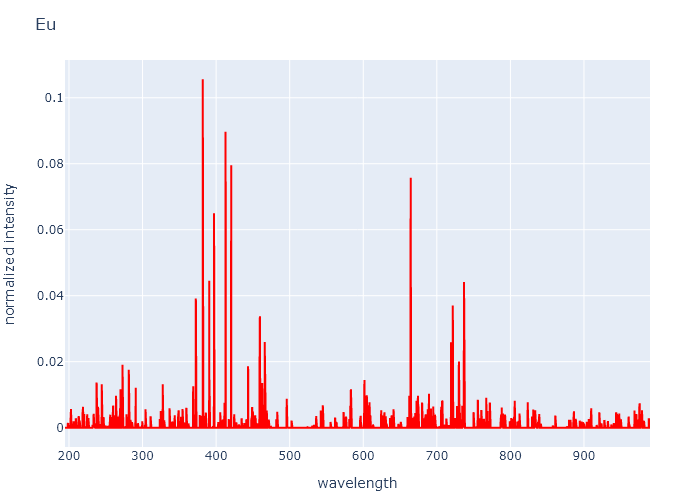
64 Gd Gadolinium
Note: spectrum extracted from a glass melt i.e. this is not pure element measurement. Check separate REE page. 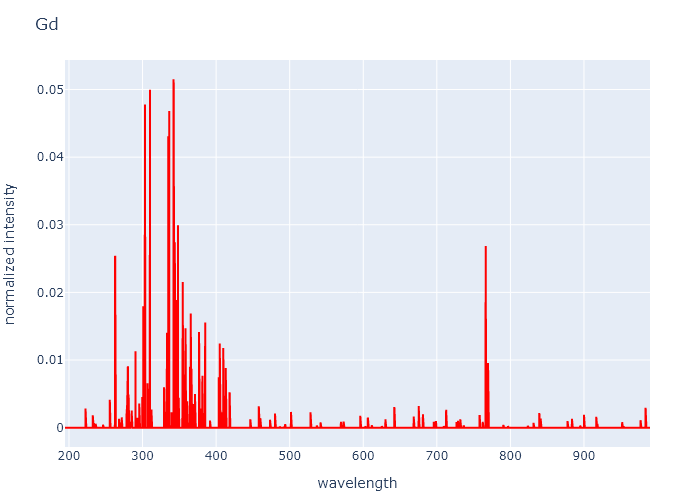
65 Tb Terbium
Note: spectrum extracted from a glass melt i.e. this is not pure element measurement. Check separate REE page. 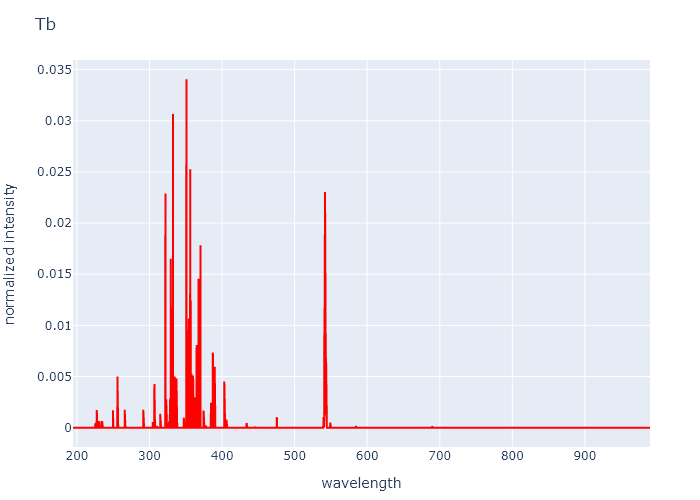
66 Dy Dysprosium
Note: spectrum extracted from a glass melt i.e. this is not pure element measurement. Check separate REE page. 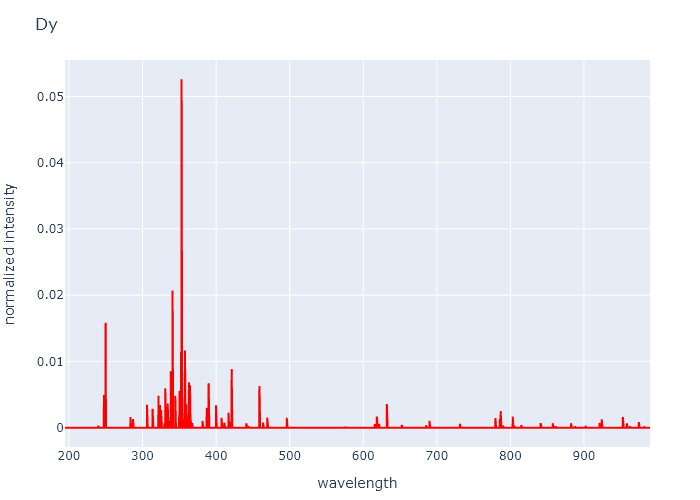
67 Ho Holmium
Note: spectrum extracted from a glass melt i.e. this is not pure element measurement. Check separate REE page. 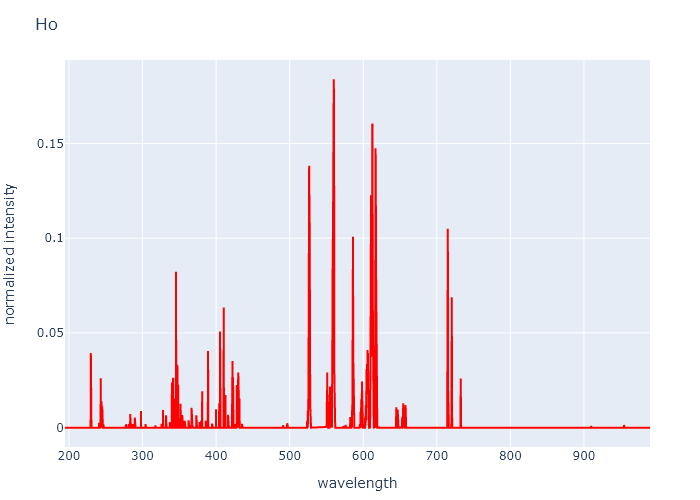
68 Er Erbium
Note: spectrum extracted from a glass melt i.e. this is not pure element measurement. Check separate REE page. 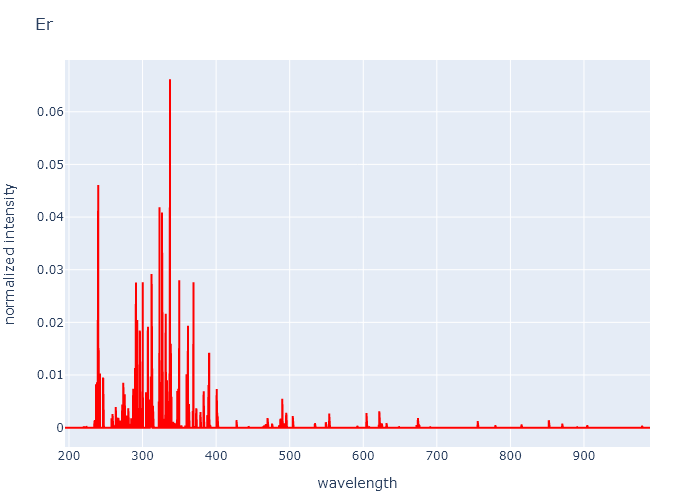
69 Tm Thulium
Note: spectrum extracted from a glass melt i.e. this is not pure element measurement. Check separate REE page. 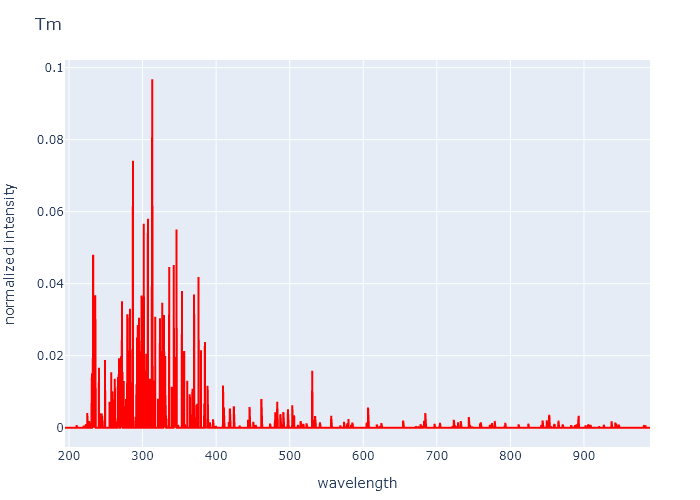
70 Yb Ytterbium
Note: spectrum extracted from a glass melt i.e. this is not pure element measurement. Check separate REE page. 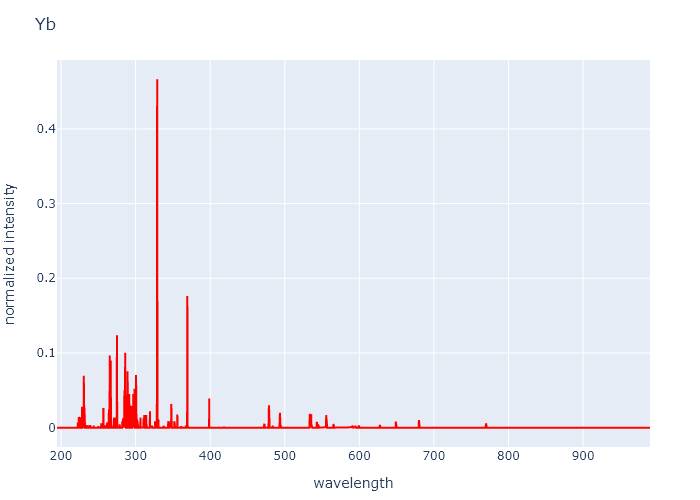
71 Lu Lutetium
Note: spectrum extracted from a glass melt i.e. this is not pure element measurement. Check separate REE page. 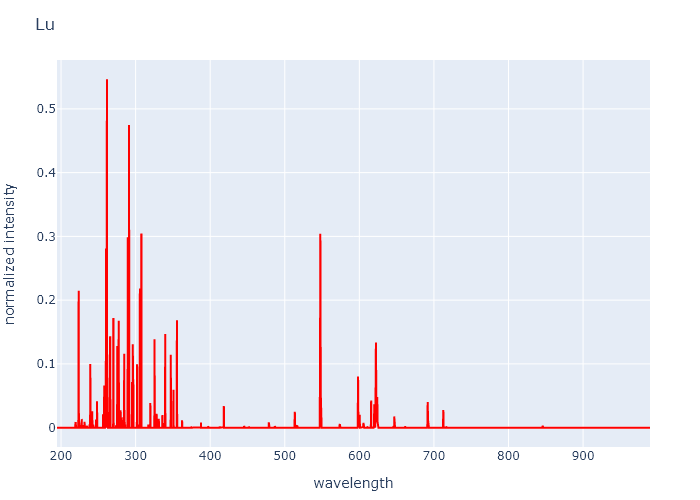
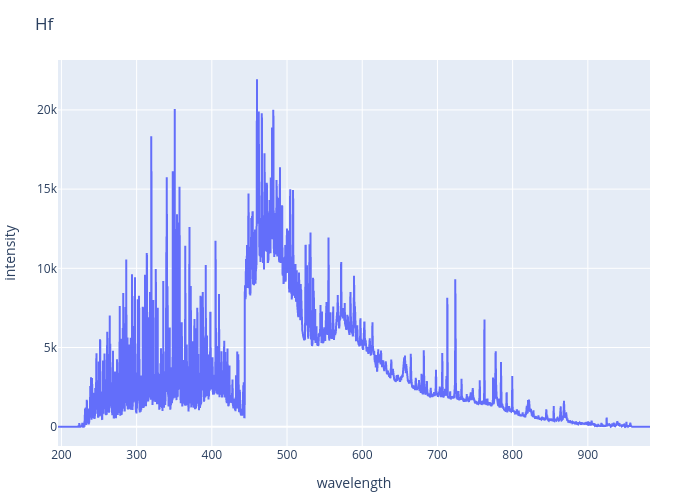
72 Hf Hafnium
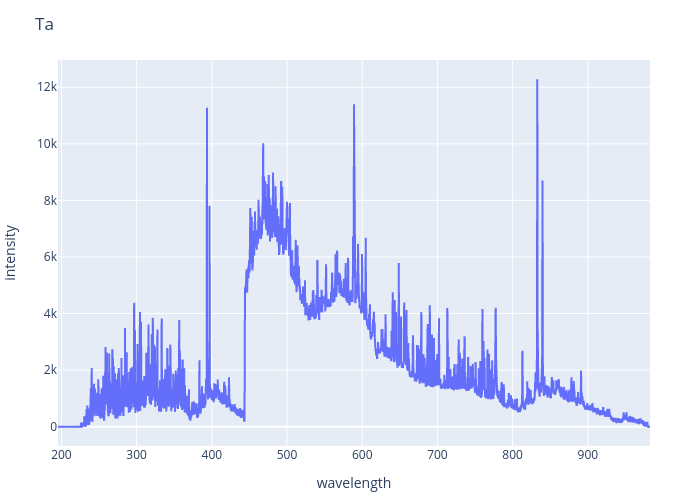
73 Ta Tantalum
74 W Tungsten
75 Re Rhenium
76 Os Osmium
77 Ir Iridium
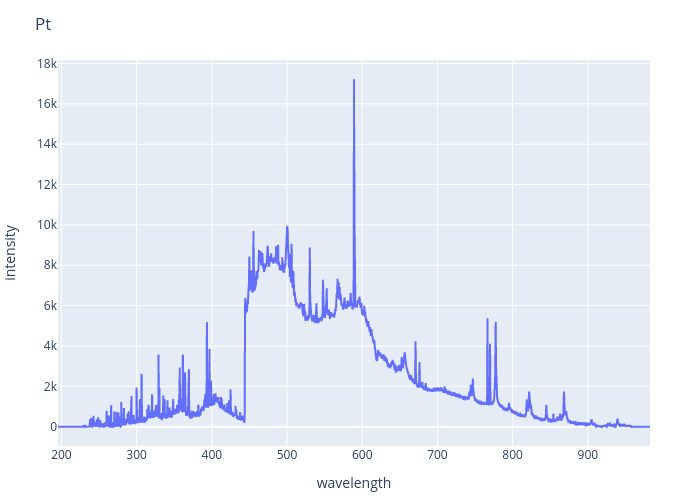
78 Pt Platinum
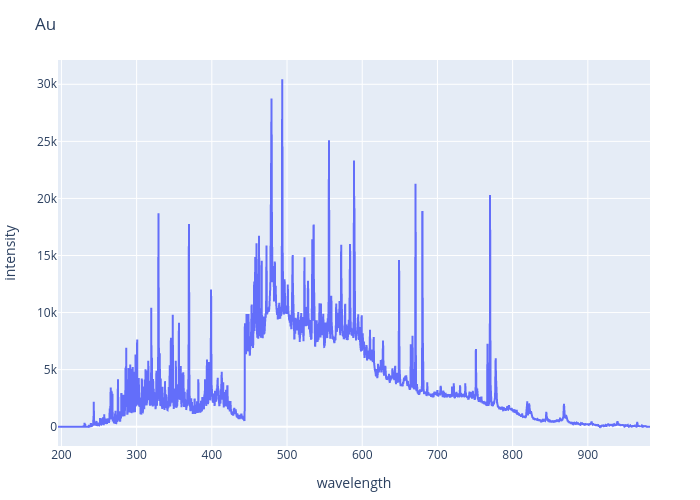
79 Au Gold
80 Hg Mercury
81 Tl Thallium
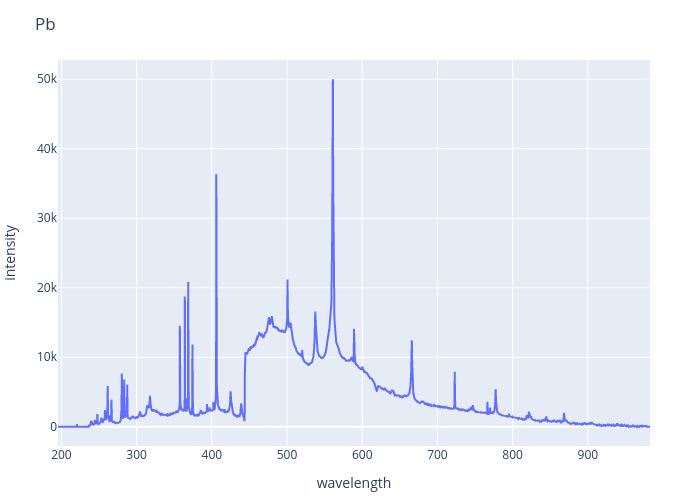
82 Pb Lead
83 Bi Bismuth
84 Po Polonium
85 At Astatine
86 Rn Radon
87 Fr Francium
88 Ra Radium
89 Ac Actinium
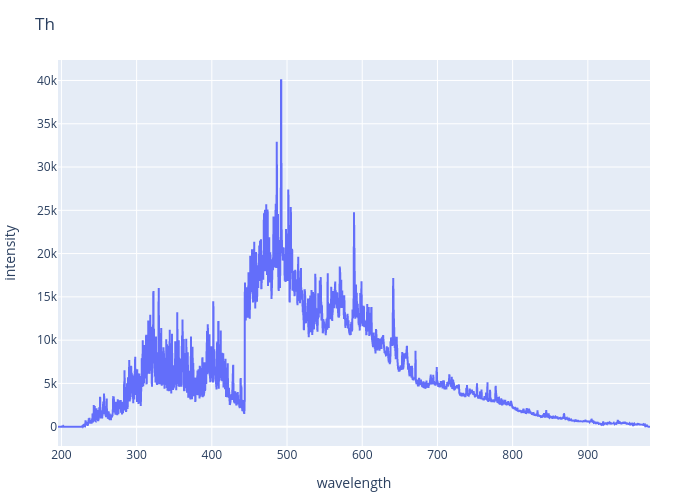
90 Th Thorium
91 Pa Protactinium
92 U Uranium
This is a bad measurement that seems to show mostly sodium, which would be from dust contamination. Some uranium peaks might be visible so I keep the result here for now until I get better. With U we got only a small number of somewhat successful measurements so this spectrum is not as good quality and the image here is 99%-percentile quantile to make peaks visible. 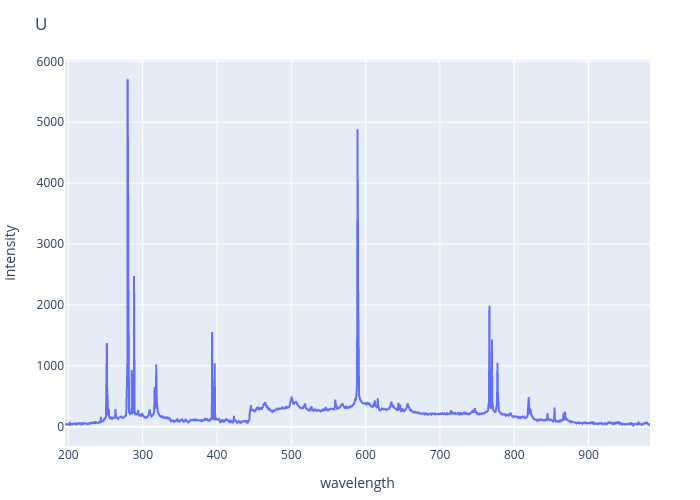
93 Np Neptunium
94 Pu Plutonium
95 Am Americium
Note that elements from 95 americium forward do not occur naturally and are artificially made.