REE-elements LIBS spectra from glass melts report
Quick link to Pluto notebook codes where this data is processed.
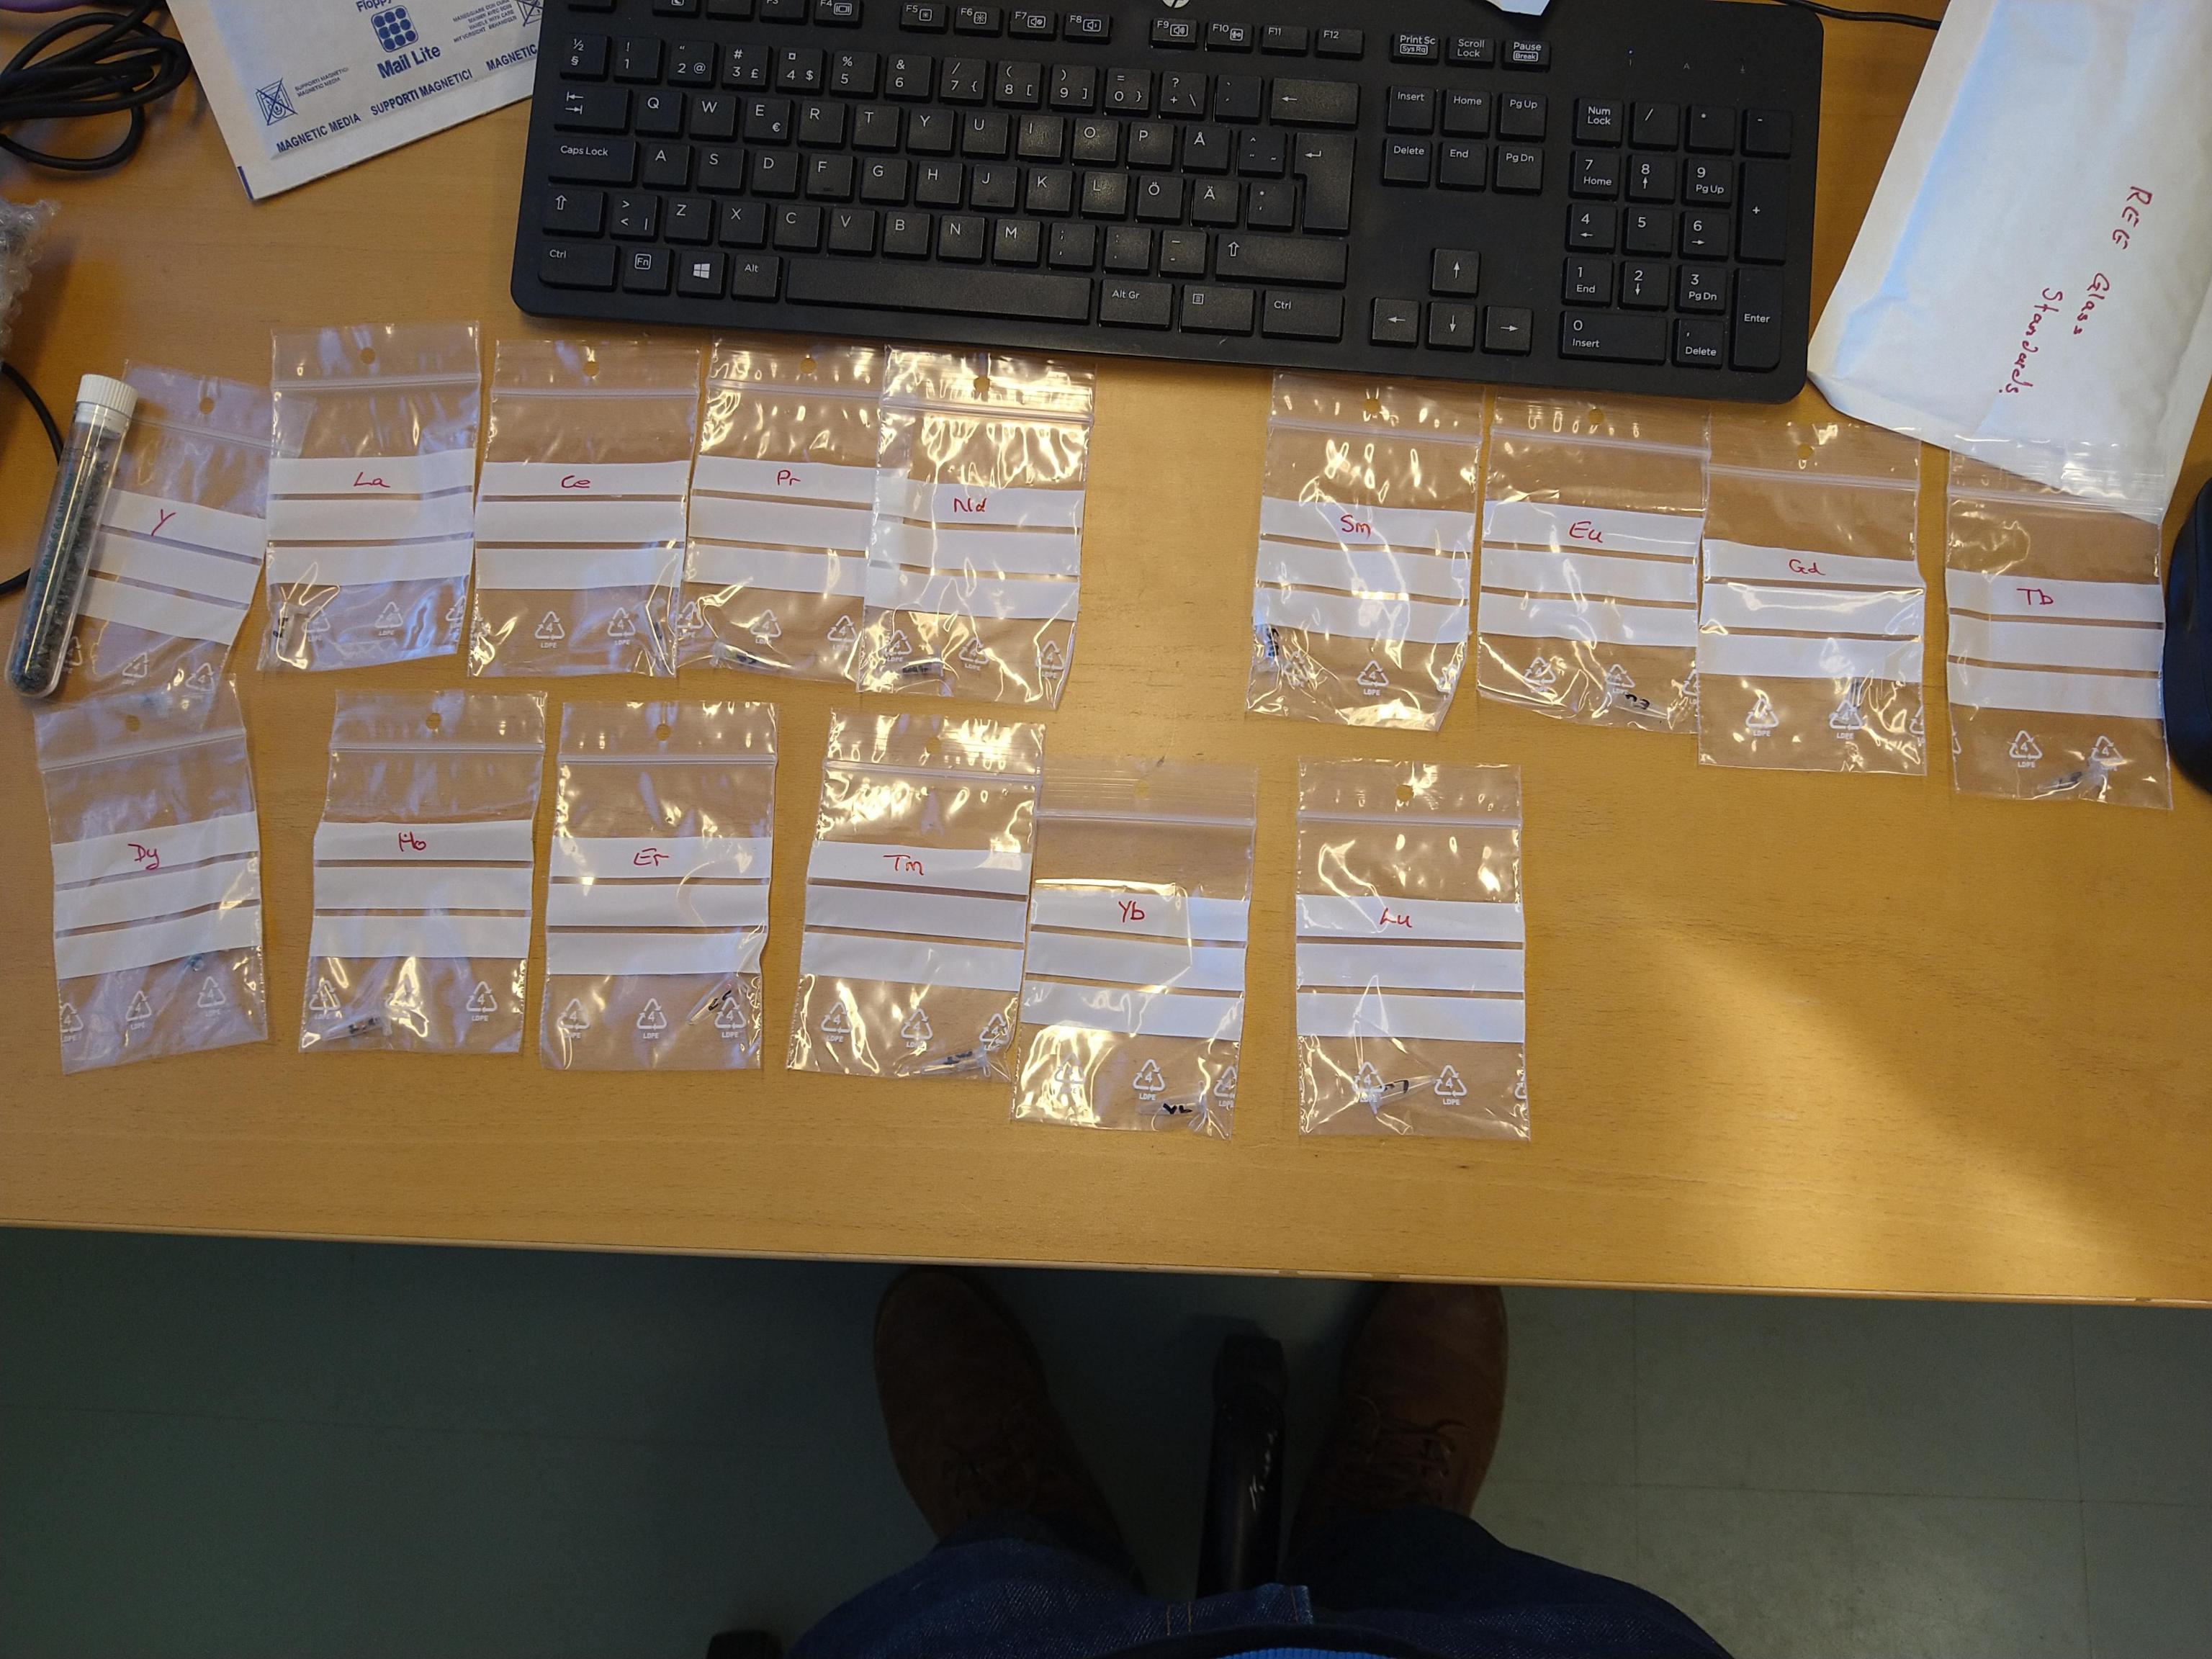
Samples
We have a set of Rare Earth Element(REE) reference samples as glass melts kindly provided by the University of Edinburgh. Information about these samples is available from https://www.ed.ac.uk/geosciences/about/facilities/all/ionprobe/technical/standards/ree. E. Cairns, P.C. Choi, J. Craven, K. Fearnhead, P. Hadden, P. Hill, S. Malik, M. Saunders A. Simonetti, D. Steele, E. Tomlinson. ‘Rare Earth Element (REE) Standards’. The University of Edinburgh, 2 June 2021. Available: https://www.ed.ac.uk/geosciences/about/facilities/all/ionprobe/technical/standards/ree
The samples are small pieces of transparent glass. 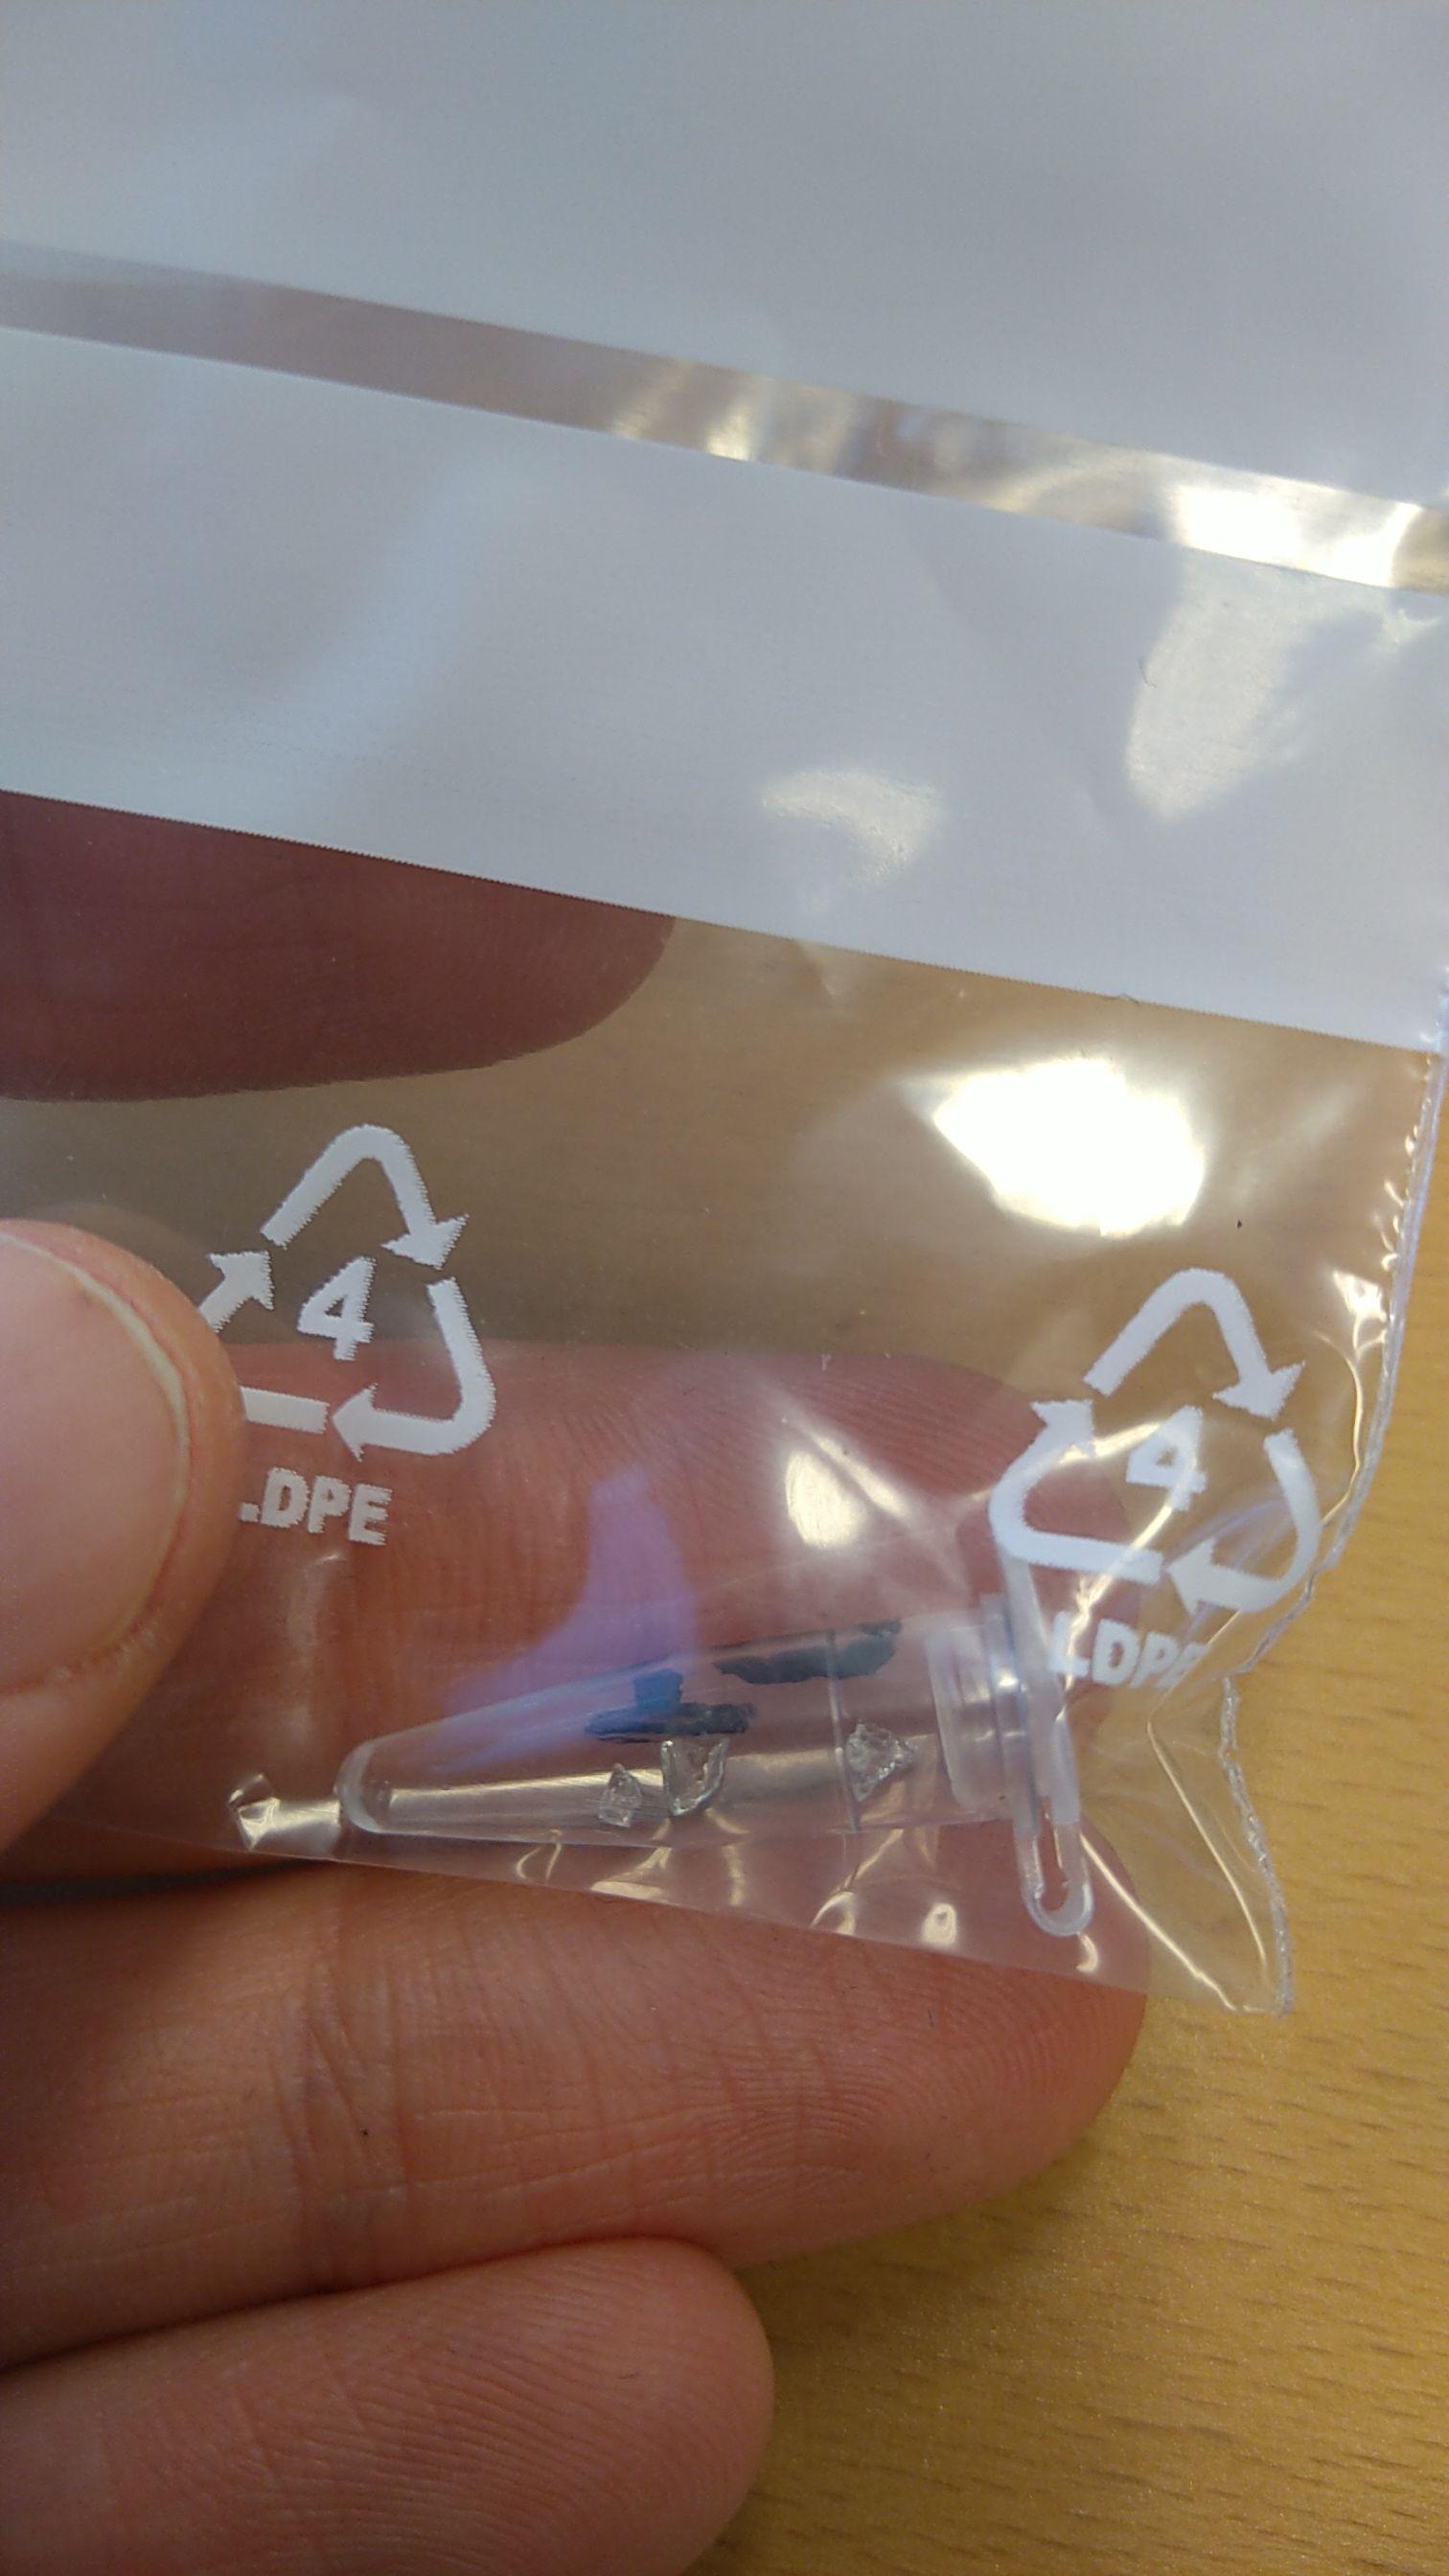
Measurements
Measurements were done in 2024 at Lumo Analytics' facilities at Atomitie 5, Helsinki. The scanner device used is Lumo Analytics' LASOLIBS drill core scanner. It works similarly than our LASOLIBS.
The measurement was done with usual sample scan setup as the laser profiler was able to pick up the glass surfaces and LIBS focus worked alright even with these challenging samples. Varying amount of successful measurements was acquired from each sample.
Data
There is varying amount of successful LIBS measurements from each sample and we look only the most successful measurements. The material is homogenous so even 1 good measurement is enough.
The spectra for each sample are below with raw spectrum and then processed one with the glass part cut off of the signal. Full data will available to download in netCDF format from xxx. Not yet?
Data processing
You can see the julia code on how the data was processed in this Pluto notebook. The main part is calculating the common spectrum part of the all the samples, i.e. contribution from the Si-Al-Ca-O glass and subtracting that for each to get only the REE specific peaks visible.
Per sample spectra
Note: Click on a plot to open an interactive version where you can zoom! And for single element downloads. Below are the experimental spectra for each REE glass melt. Both the actual measurement and then the REE specific part of the spectrum.
Y
For Y we have a pure element sample measured as well, comparison is below.
Measurement spectrum: 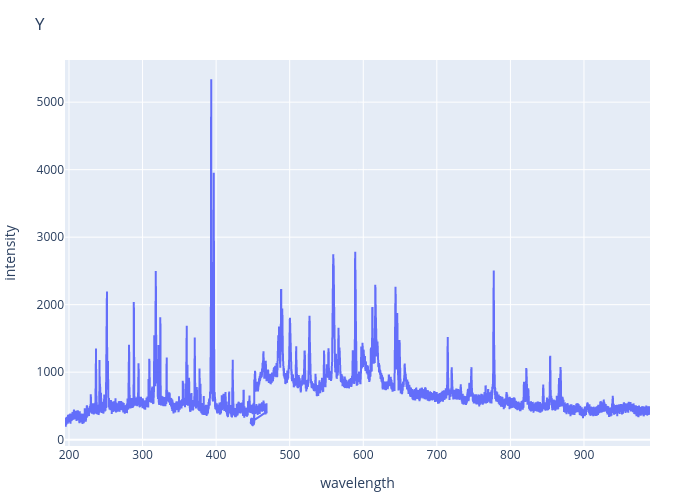
Unique spectrum: 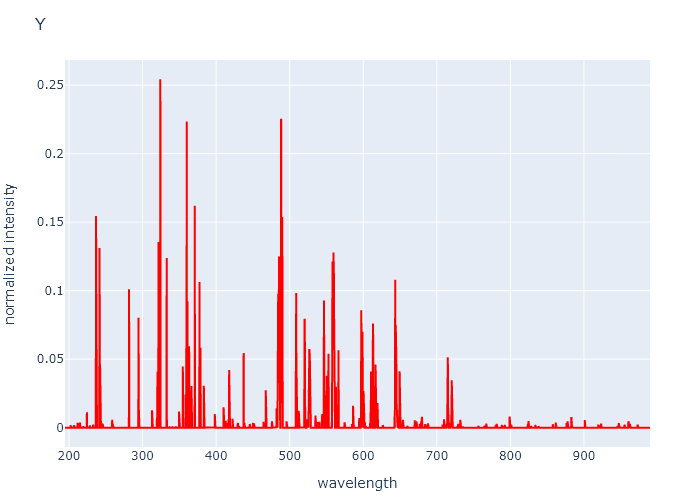
Comparison of common part, measurement and unique part: 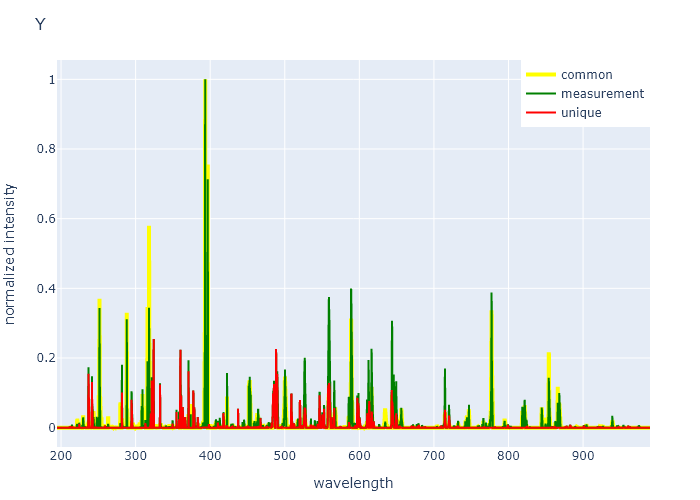
Comparison to pure element measurement: (TODO) 
La
Measurement spectrum: 
Unique spectrum: 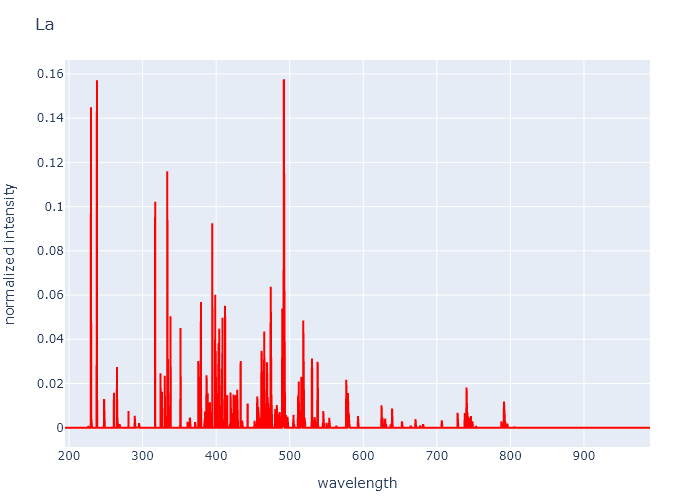
Comparison of common part, measurement and unique part: 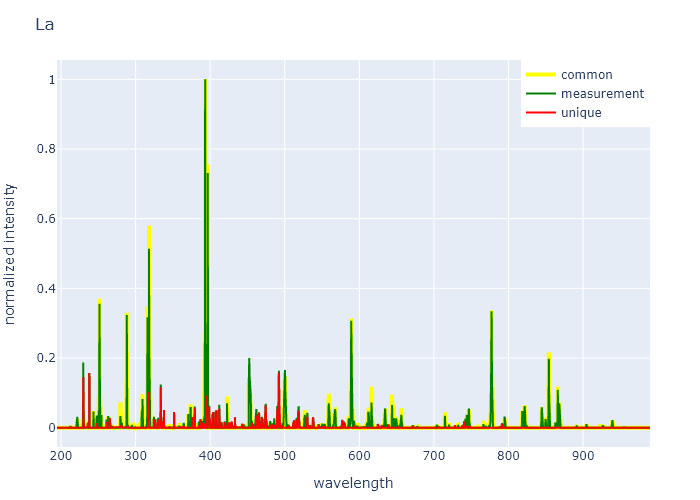
Ce
Measurement spectrum: 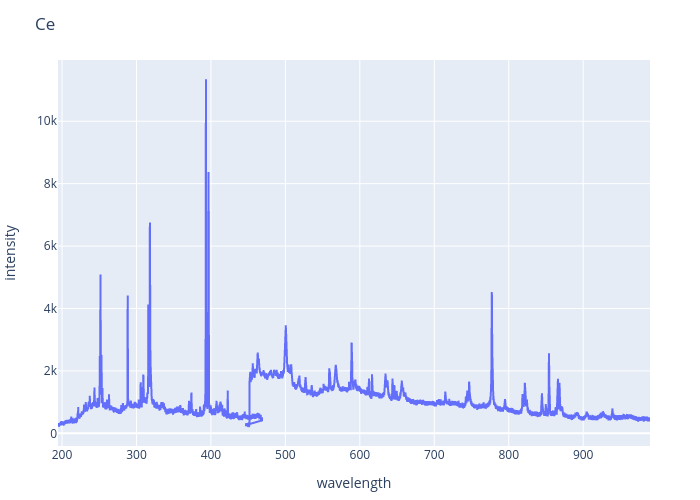
Unique spectrum: 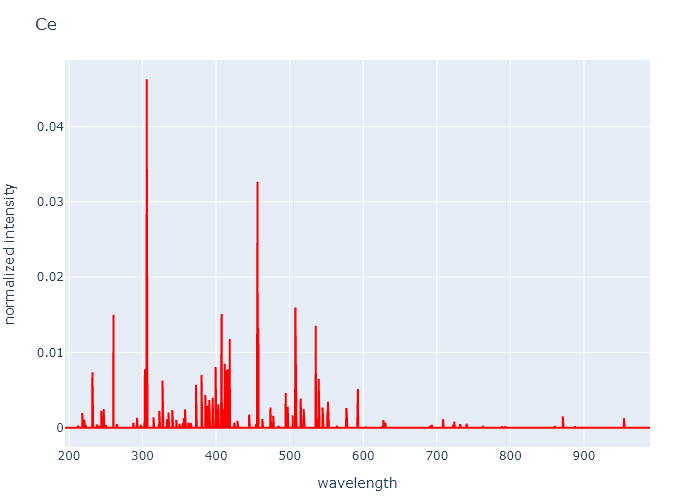
Comparison of common part, measurement and unique part: 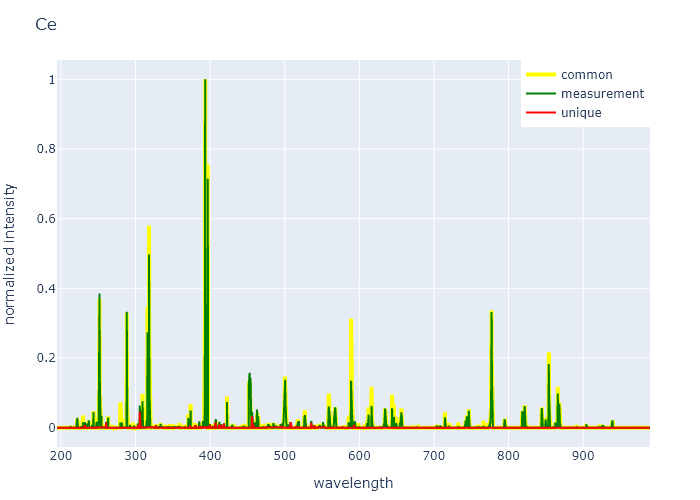
Pr
Measurement spectrum: 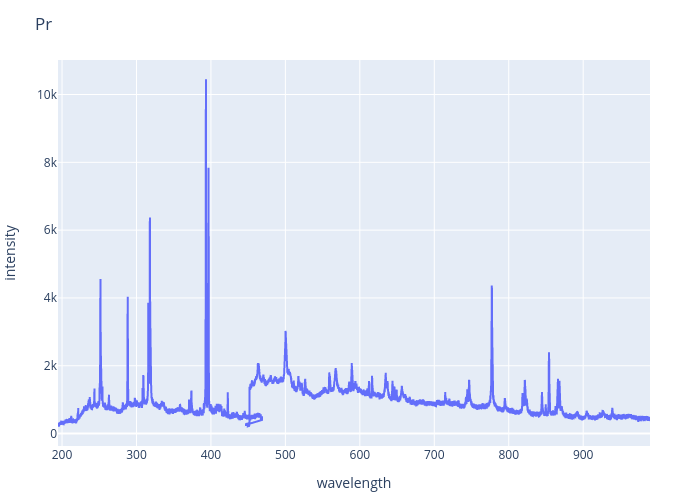
Unique spectrum: 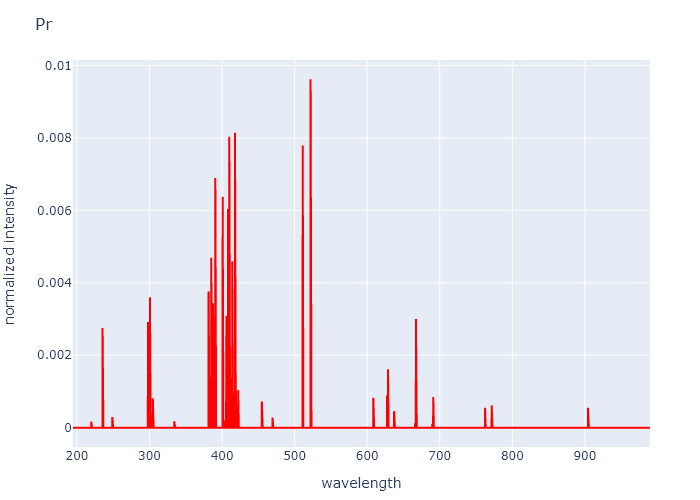
Comparison of common part, measurement and unique part: 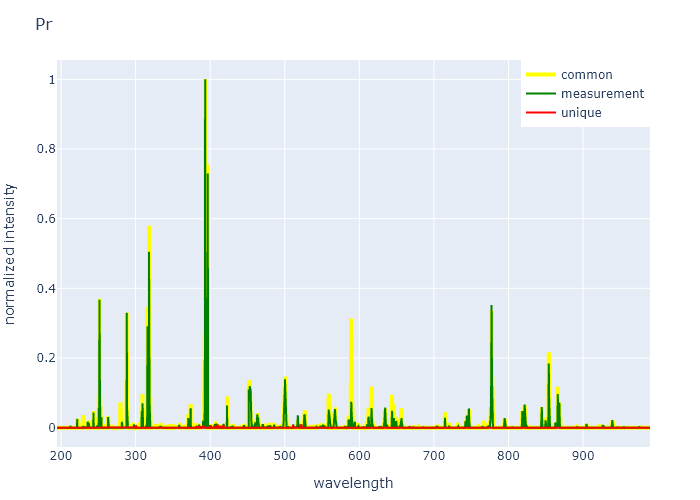
Nd
Measurement spectrum: 
Unique spectrum: 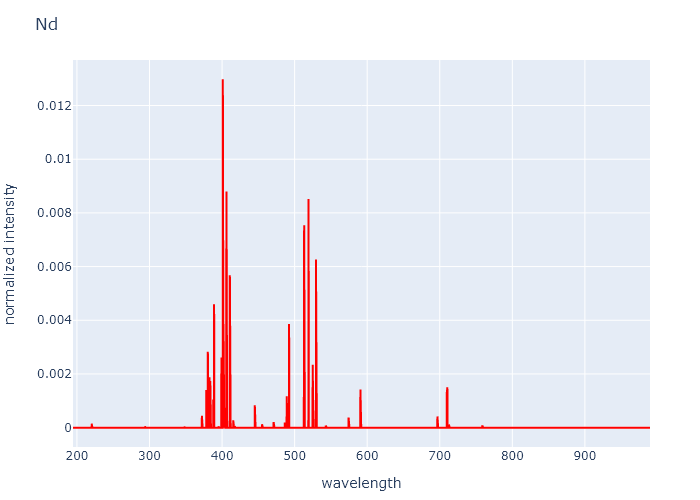
Comparison of common part, measurement and unique part: 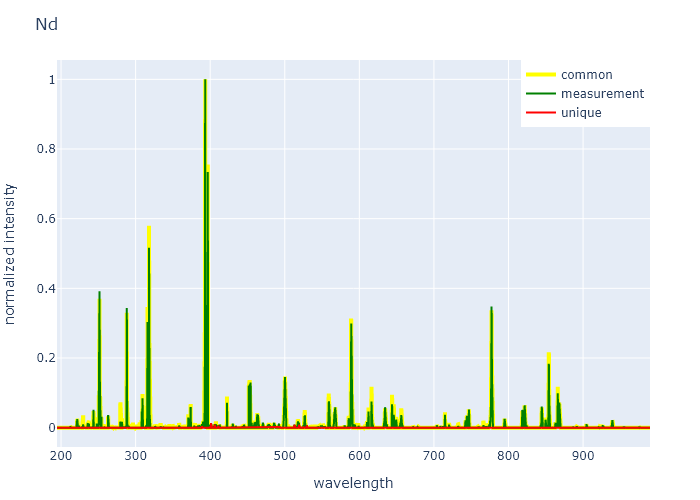
Sm
Measurement spectrum: 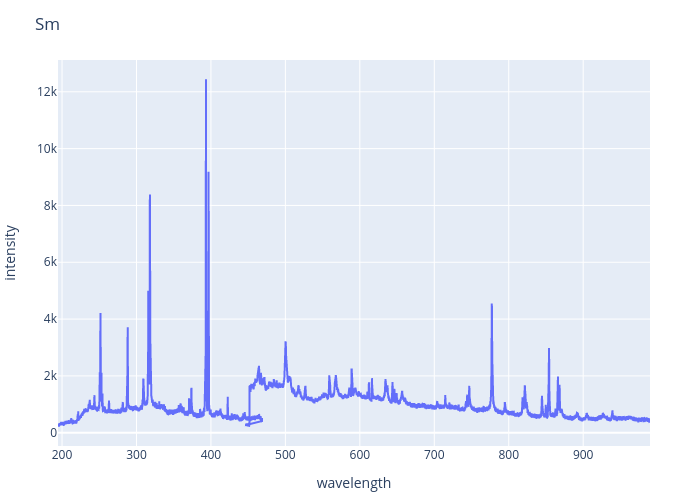
Unique spectrum: 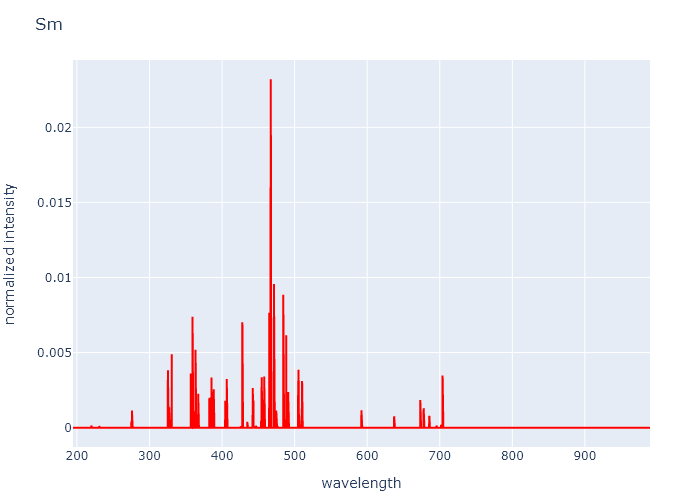
Comparison of common part, measurement and unique part: 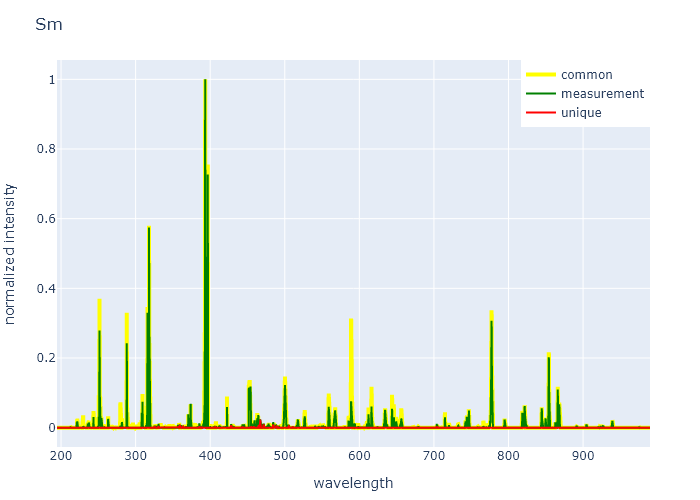
Eu
Measurement spectrum: 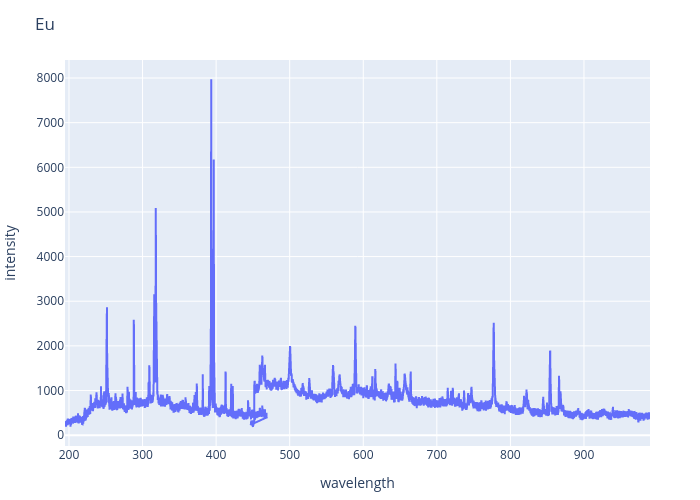
Unique spectrum: 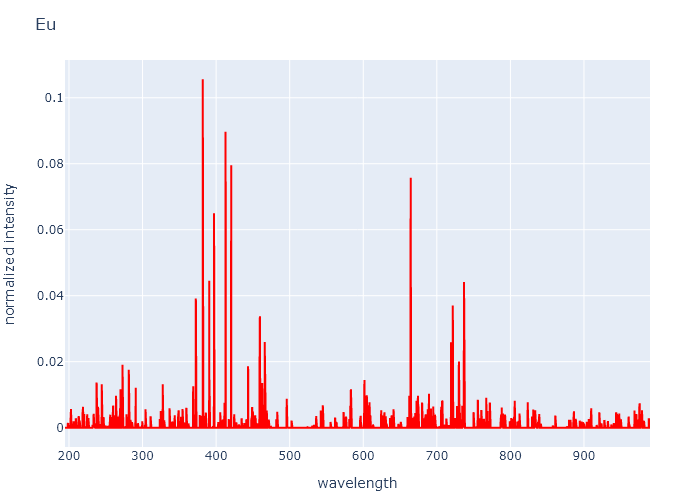
Comparison of common part, measurement and unique part: 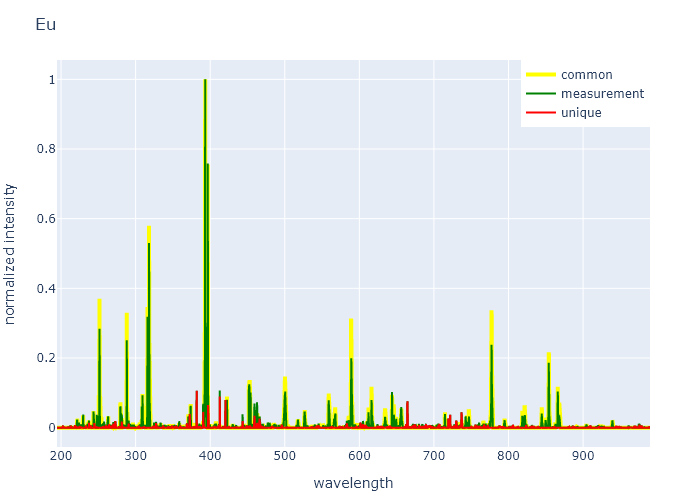
Gd
Measurement spectrum: 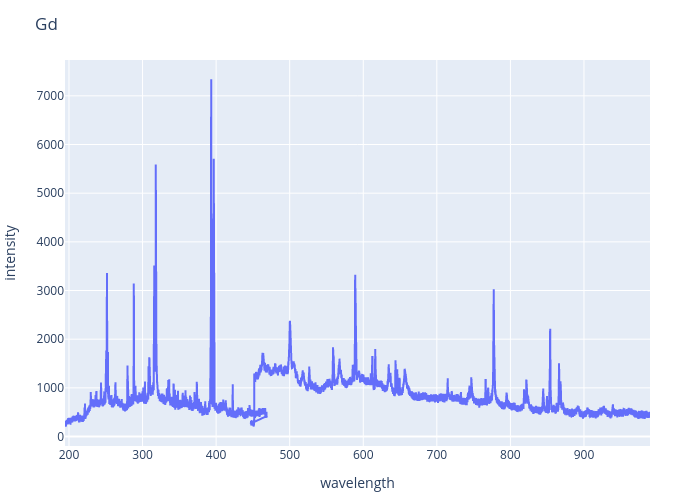
Unique spectrum: 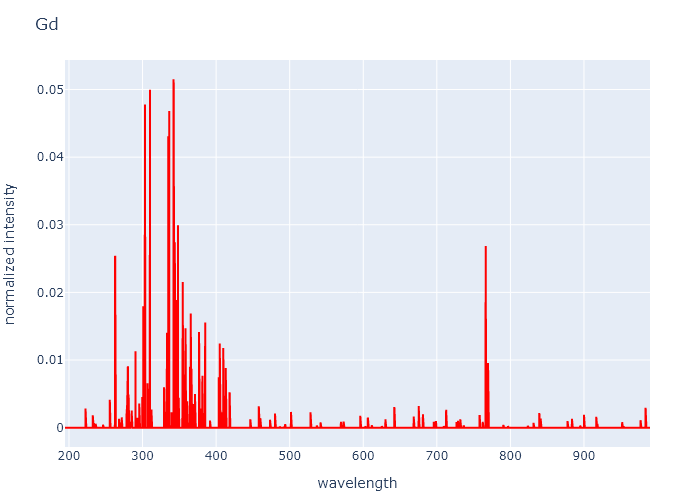
Comparison of common part, measurement and unique part: 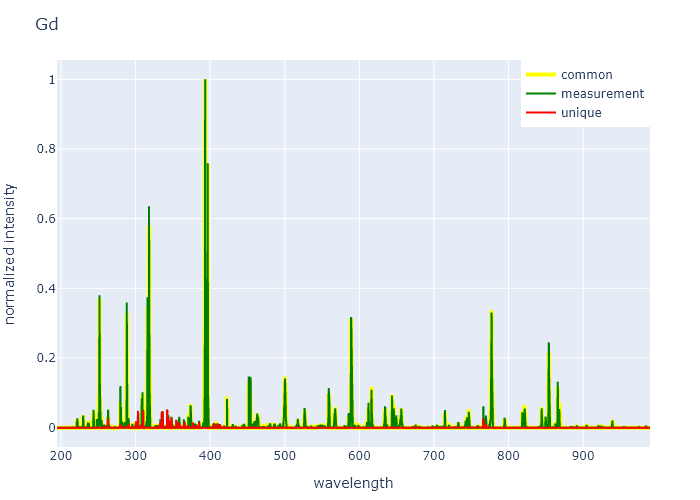
Tb
Measurement spectrum: 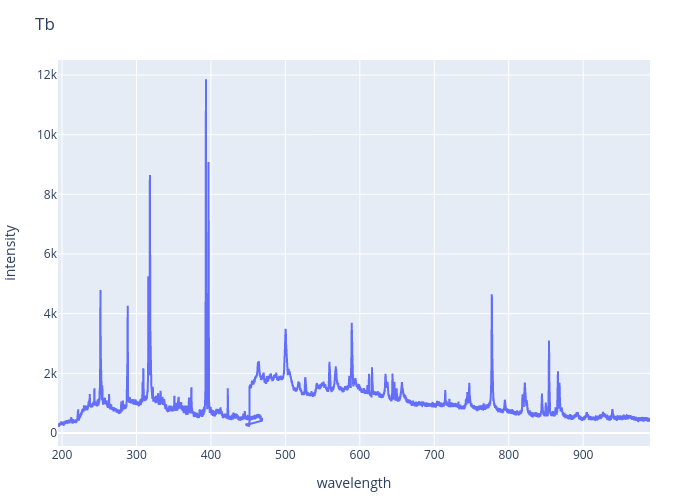
Unique spectrum: 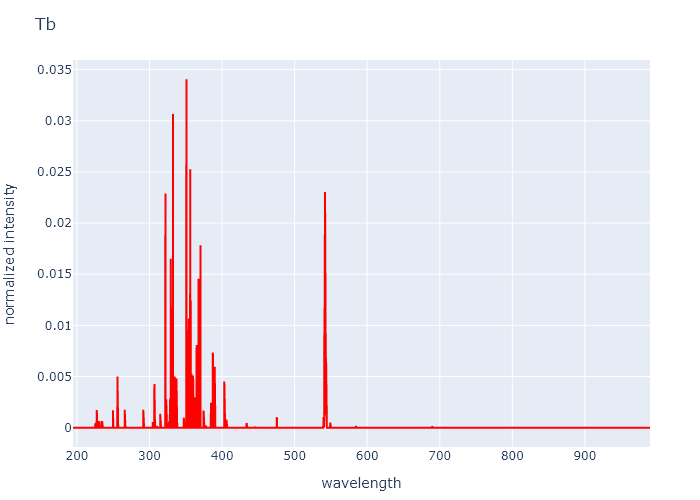
Comparison of common part, measurement and unique part: 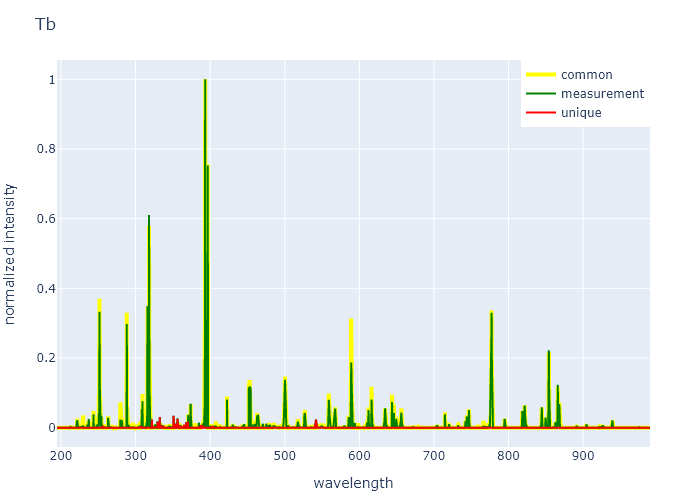
Dy
Measurement spectrum: 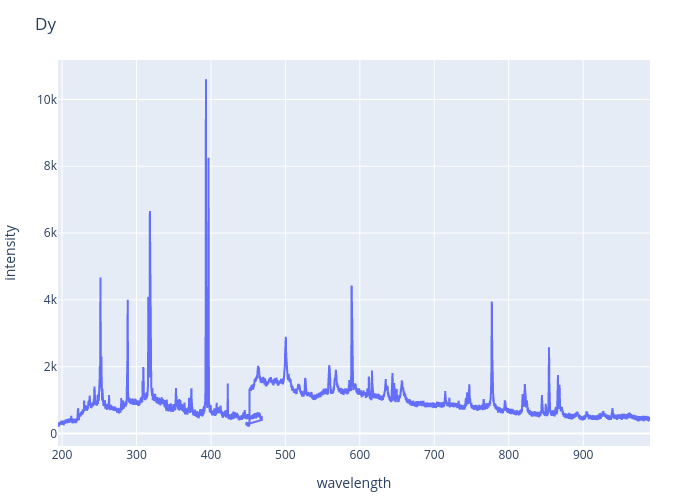
Unique spectrum: 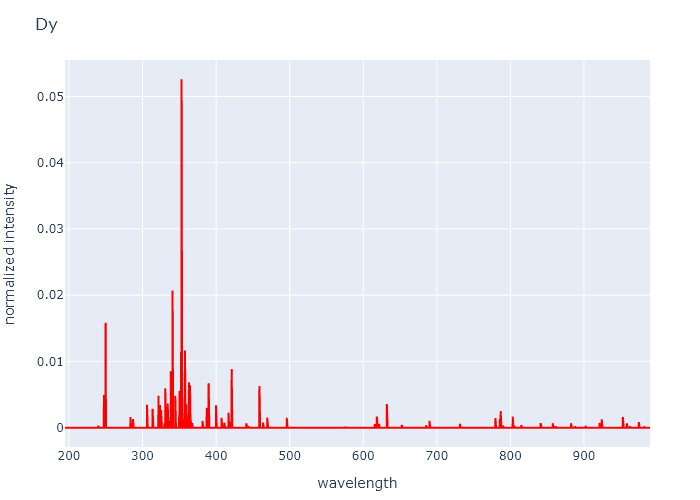
Comparison of common part, measurement and unique part: 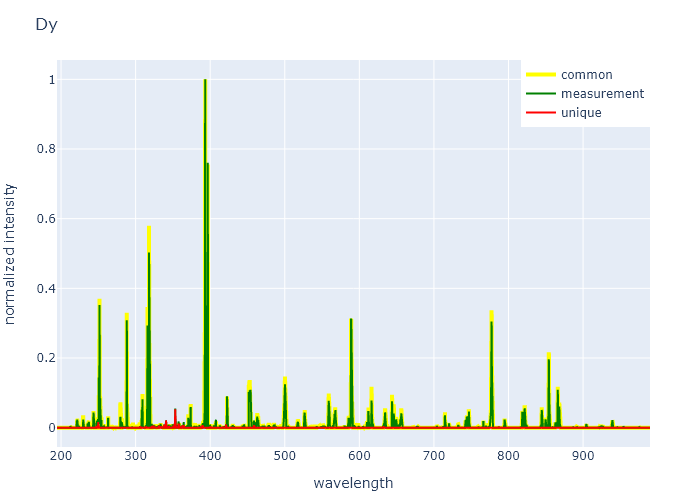
Ho
Measurement spectrum: 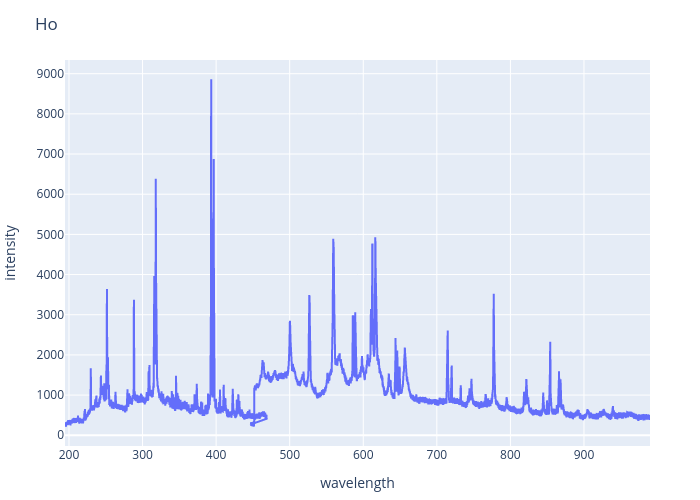
Unique spectrum: 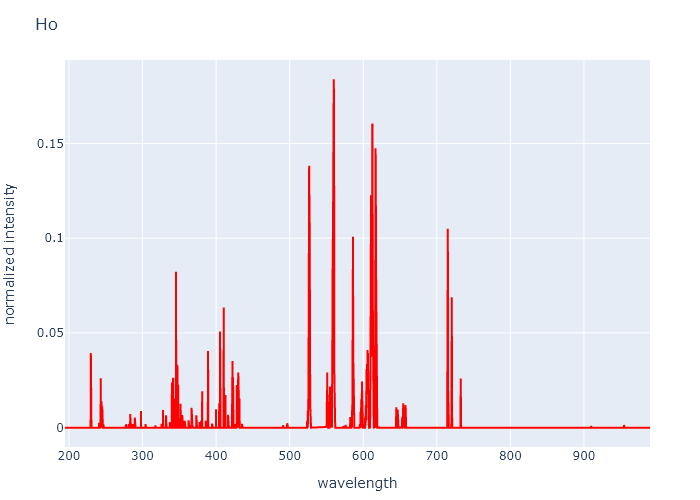
Comparison of common part, measurement and unique part: 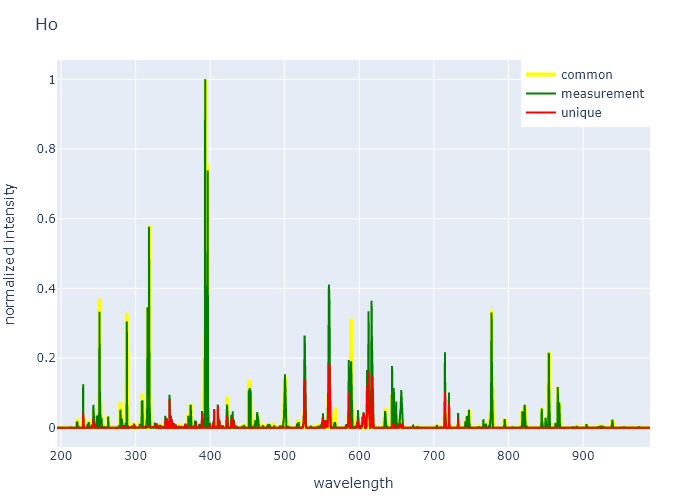
Er
Measurement spectrum: 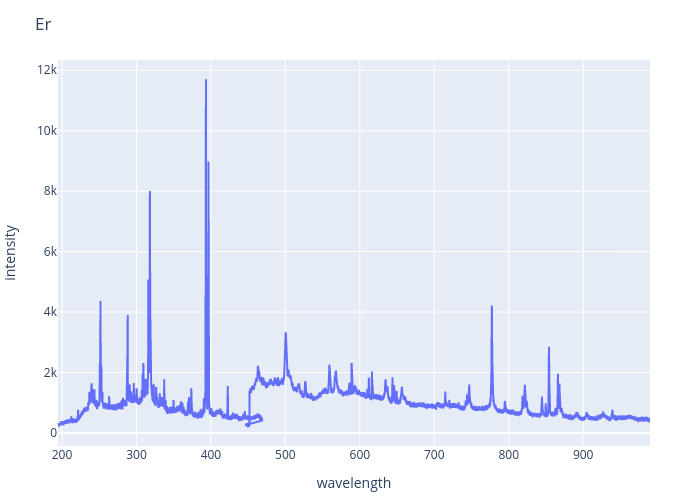
Unique spectrum: 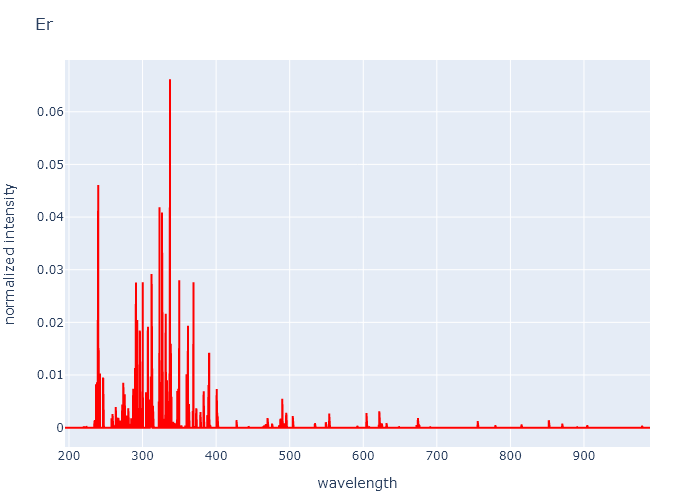
Comparison of common part, measurement and unique part: 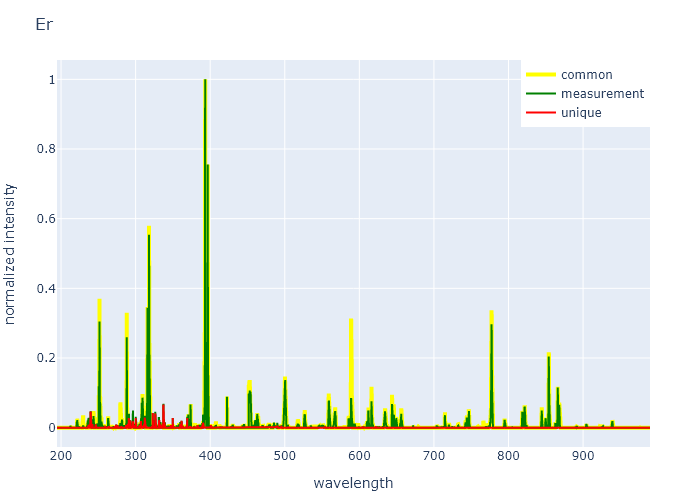
Tm
Measurement spectrum: 
Unique spectrum: 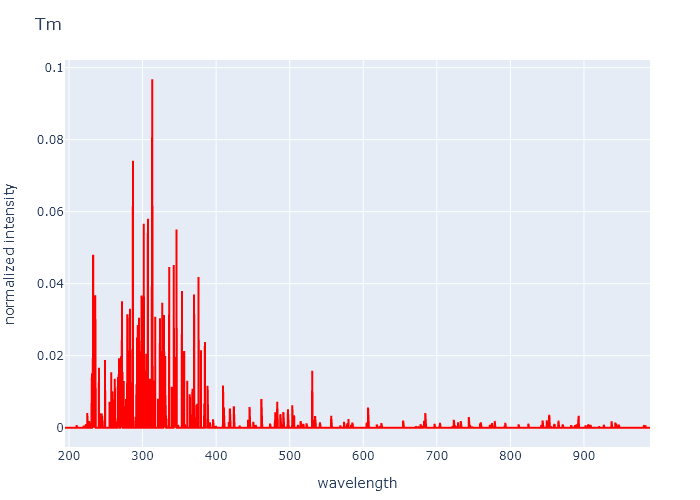
Comparison of common part, measurement and unique part: 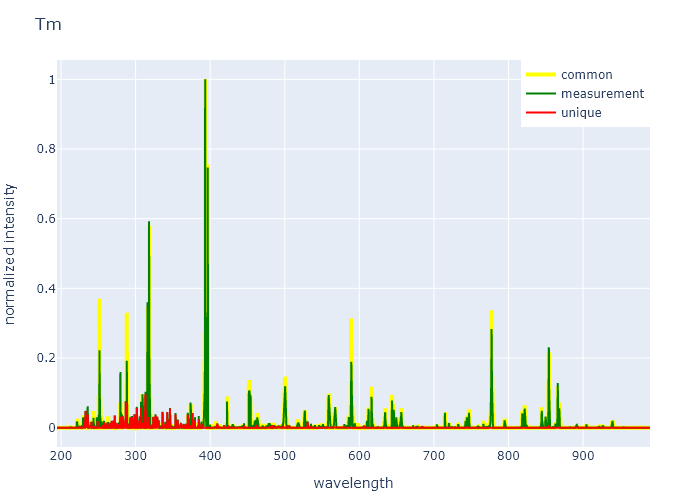
Yb
Measurement spectrum: 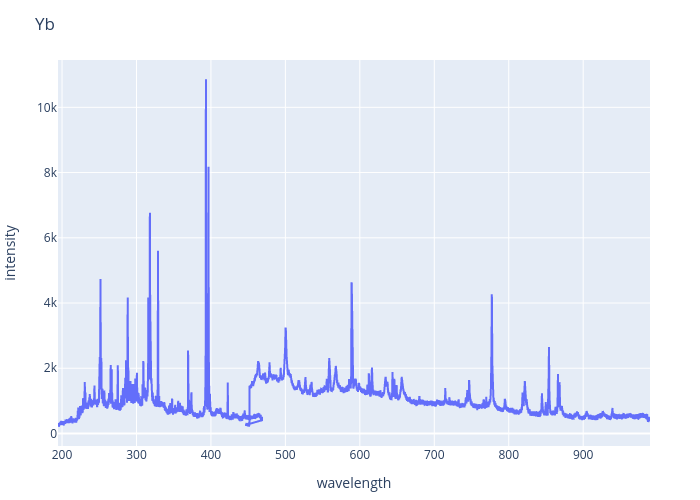
Unique spectrum: 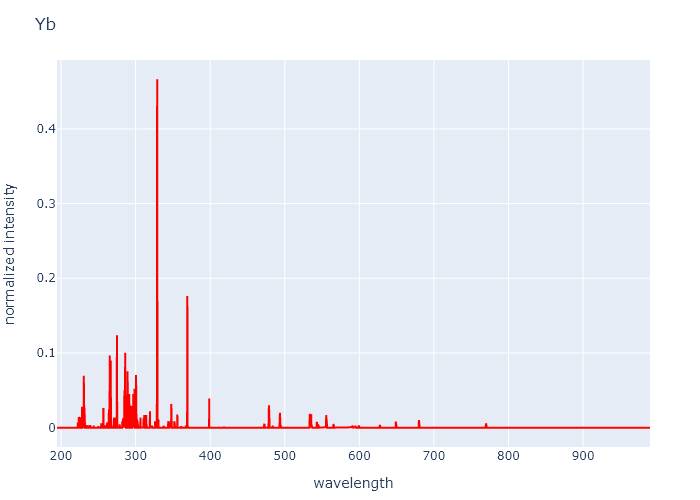
Comparison of common part, measurement and unique part: 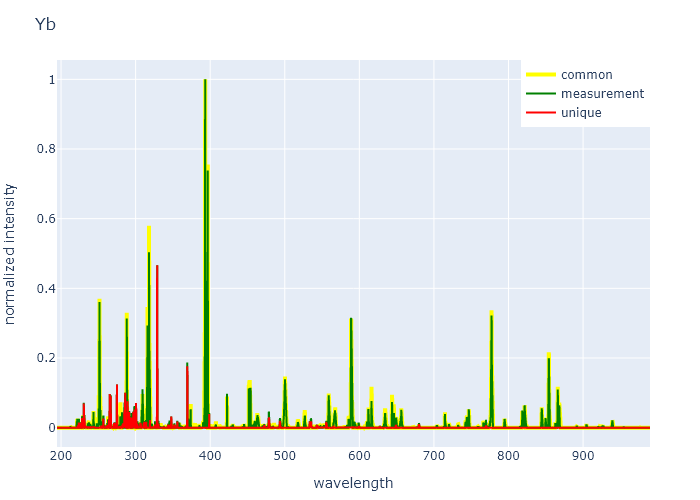
Lu
Measurement spectrum: 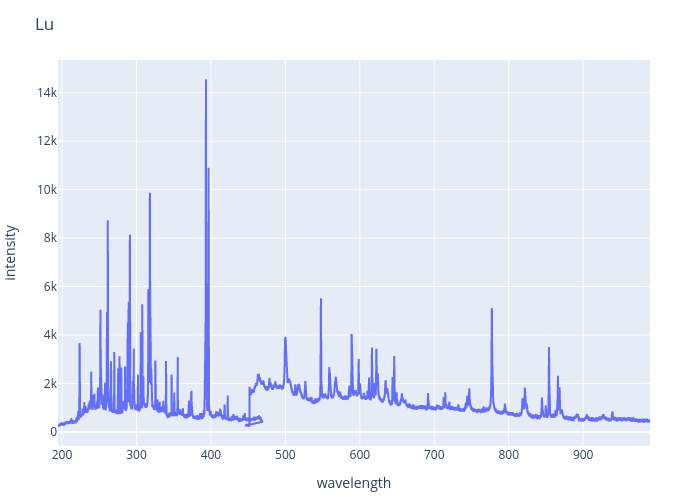
Unique spectrum: 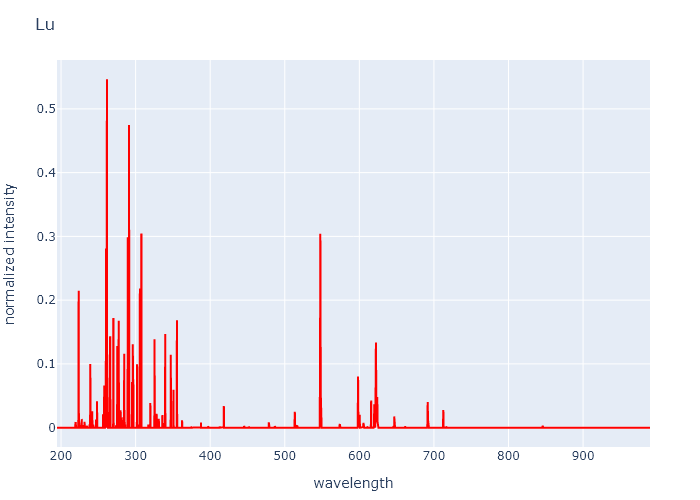
Comparison of common part, measurement and unique part: 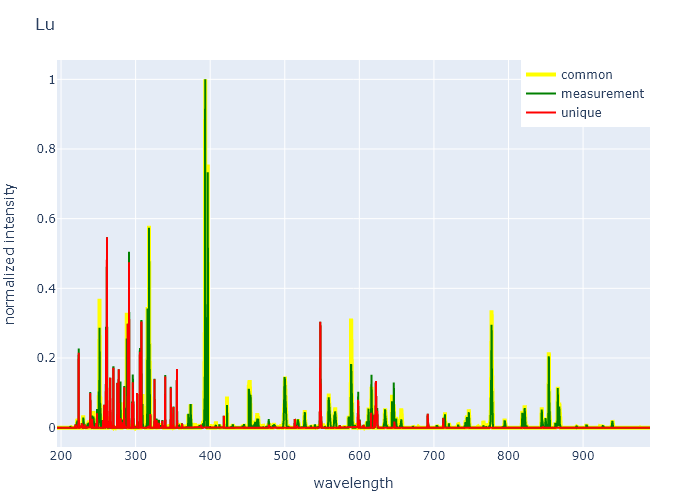
Estimating limits of detection
For a rough estimate of the limits of detection with the used LIBS setup we calculate how much the REE unique spectra above can be reduced while still keeping peaks identifiable.
There's close to 6% amount of substance of REE element in the sample. A peak under 100 intensity in these already preprocessed datas (in raw datas intensity was higher) intensity is too close to noise. Assuming linear behaviour, which may well be valid in low amounts, we calculate how much can the amount of substance be reduce to still keep peaks identifiable. Result is in the table below as amount of substance percentage from sorted from easiest to detect to hardest to detect. Conservative estimate is for hard to measure glass like material, such as these samples, and more optimistic limit is for a better more common with most minerals quality of LIBS signal.
Limits of detection as amount of substance in a single measurement from easiest to detect to hardest to detect.
| Element | Conservative LoD | Optimistic LoD |
|---|---|---|
| Lu | 0.11% | 0.022% |
| Yb | 0.13% | 0.026% |
| Y | 0.24% | 0.048% |
| Ho | 0.33% | 0.066% |
| La | 0.38% | 0.076% |
| Eu | 0.57% | 0.11% |
| Tm | 0.62% | 0.12% |
| Er | 0.91% | 0.18% |
| Dy | 1.1% | 0.22% |
| Gd | 1.2% | 0.24% |
| Ce | 1.3% | 0.26% |
| Tb | 1.8% | 0.36% |
| Sm | 2.6% | 0.52% |
| Nd | 4.6% | 0.92% |
| Pr | 6.2% | 1.2% |
Elemental analysis
The elemental concentrations of the glasses are as follows, more details on the University of Edinburgh (https://geosciences.ed.ac.uk/about/facilities/all/ionprobe/technical/standards/ree/composition)[info page on REE glass composition].
Weight percentage as oxides
| Glass | SiO2 | Al2O3 | CaO | REE2O3 |
|---|---|---|---|---|
| Y Glass | 52,33 | 12,70 | 21,00 | 13,97 |
| La Glass | 55,8 | 10,52 | 17,07 | 16,6 |
| Ce Glass | 53,72 | 10,13 | 16,44 | 19,71 |
| Pr Glass | 56,02 | 10,56 | 17,14 | 16,27 |
| Nd Glass | 55,59 | 10,49 | 17,02 | 16,89 |
| Sm Glass | 48,55 | 11,81 | 19,44 | 20,2 |
| Eu Glass | 41,93 | 13,25 | 21,74 | 23,09 |
| Gd Glass | 48,16 | 11,71 | 19,29 | 20,85 |
| Tb Glass | 46,59 | 11,72 | 19,38 | 22,28 |
| Dy Glass | 47,87 | 11,63 | 19,21 | 21,3 |
| Ho Glass | 47,13 | 11,72 | 19,38 | 21,76 |
| Er Glass | 45,24 | 12,09 | 19,95 | 22,72 |
| Tm Glass | 37,31 | 13,79 | 22,78 | 26,12 |
| Yb Glass | 47,02 | 11,56 | 19,08 | 22,34 |
| Lu Glass | 47,29 | 11,49 | 18,91 | 22,31 |
Amount of substance for elements as percentage
| Glass | Si | Al | Ca | REE | O |
|---|---|---|---|---|---|
| Y Glass | 18,26 | 5,22 | 7,85 | 6,59 | 62,08 |
| La Glass | 20,60 | 4,58 | 6,75 | 5,30 | 62,77 |
| Ce Glass | 20,01 | 4,45 | 6,56 | 6,30 | 62,69 |
| Pr Glass | 20,70 | 4,60 | 6,79 | 5,13 | 62,78 |
| Nd Glass | 20,64 | 4,59 | 6,77 | 5,22 | 62,77 |
| Sm Glass | 18,50 | 5,30 | 7,94 | 6,15 | 62,11 |
| Eu Glass | 16,31 | 6,07 | 9,06 | 7,10 | 61,45 |
| Gd Glass | 18,51 | 5,30 | 7,94 | 6,12 | 62,11 |
| Tb Glass | 18,06 | 5,35 | 8,05 | 6,53 | 62,00 |
| Dy Glass | 18,52 | 5,30 | 7,96 | 6,10 | 62,11 |
| Ho Glass | 18,33 | 5,37 | 8,08 | 6,17 | 62,05 |
| Er Glass | 17,75 | 5,59 | 8,39 | 6,40 | 61,87 |
| Tm Glass | 15,06 | 6,56 | 9,85 | 7,50 | 61,04 |
| Yb Glass | 18,45 | 5,35 | 8,02 | 6,09 | 62,09 |
| Lu Glass | 18,58 | 5,32 | 7,96 | 6,02 | 62,12 |
TODO: Amount of substance as calculated from LIBS measurement. note the calculation is done with an experimental non-verified method so I cant vouch for the accuracy of these numbers, other than where they seem to agree with other measurments.
| Glass | Si | Al | Ca | REE | O |
|---|---|---|---|---|---|
| Y Glass | |||||
| La Glass | |||||
| Ce Glass | |||||
| Pr Glass | |||||
| Nd Glass | |||||
| Sm Glass | |||||
| Eu Glass | |||||
| Gd Glass | |||||
| Tb Glass | |||||
| Dy Glass | |||||
| Ho Glass | |||||
| Er Glass | |||||
| Tm Glass | |||||
| Yb Glass | |||||
| Lu Glass |
Comparisons to reference elemental lines and theoretically predicted spectra
TODO: