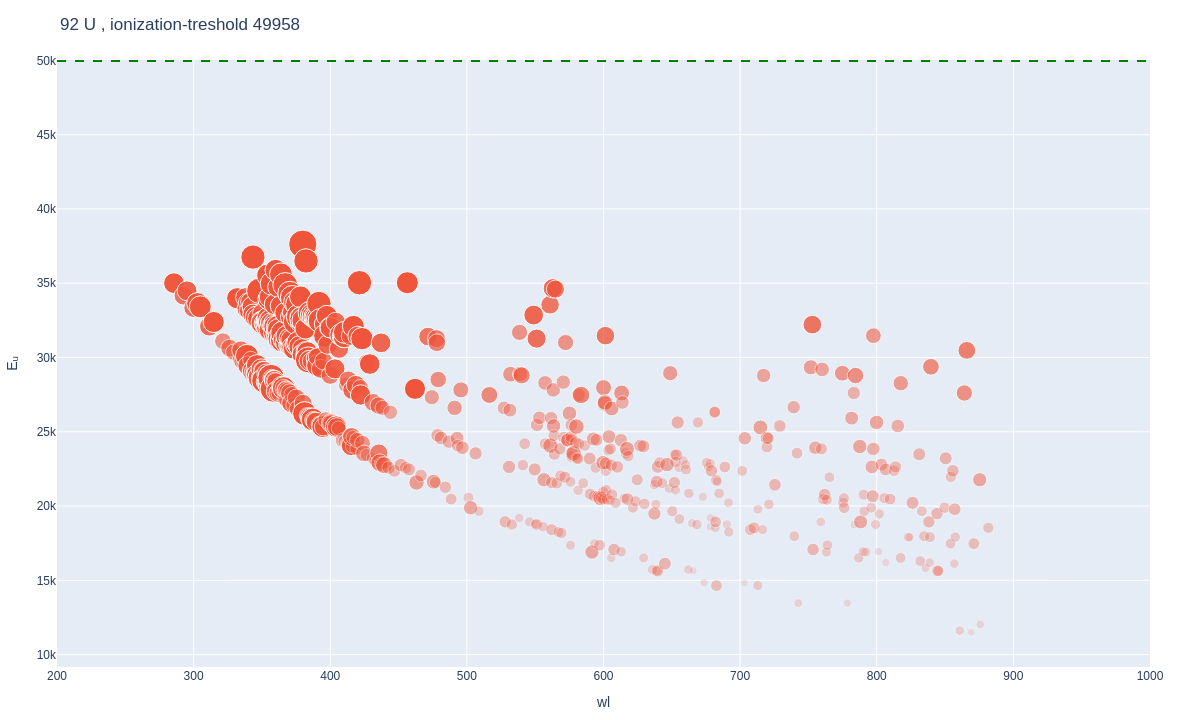
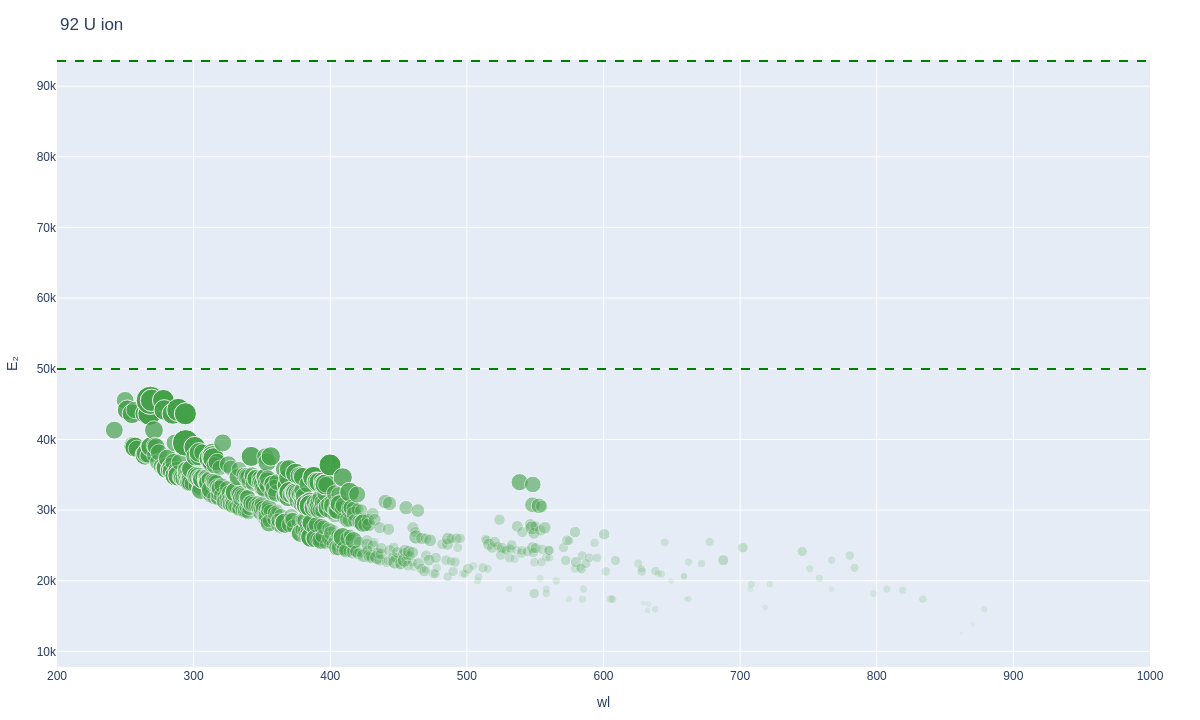
Atomic line plots and minimal and maximal spectra for every element
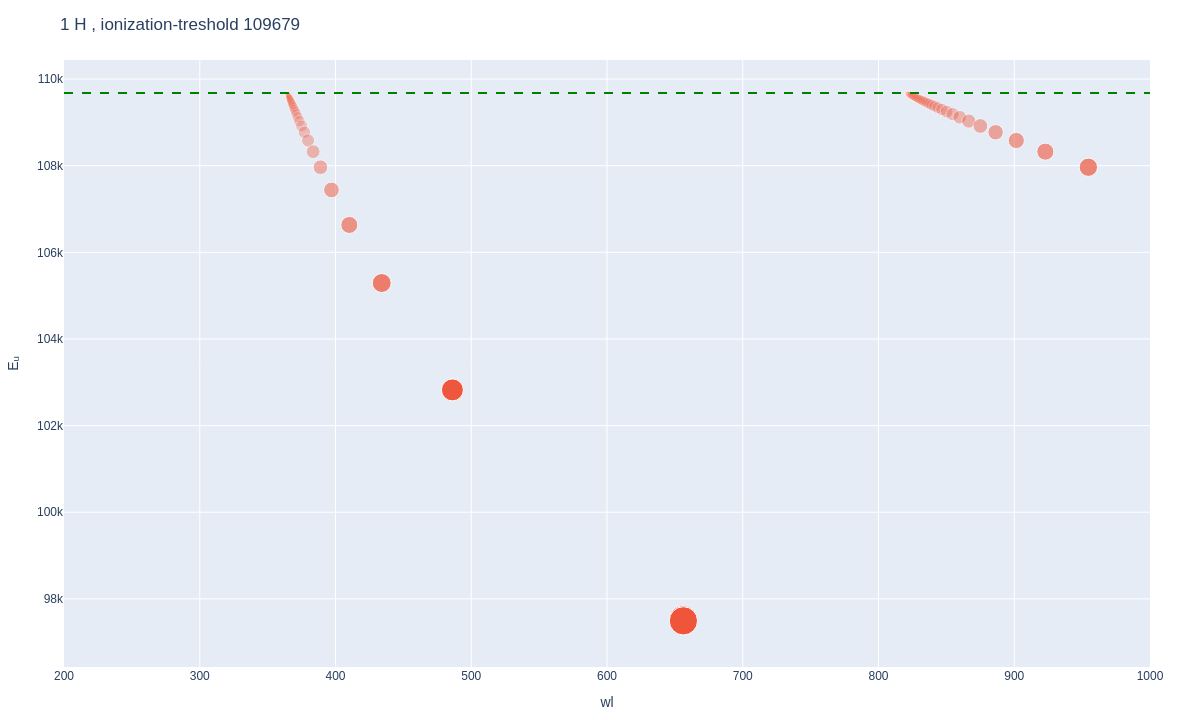
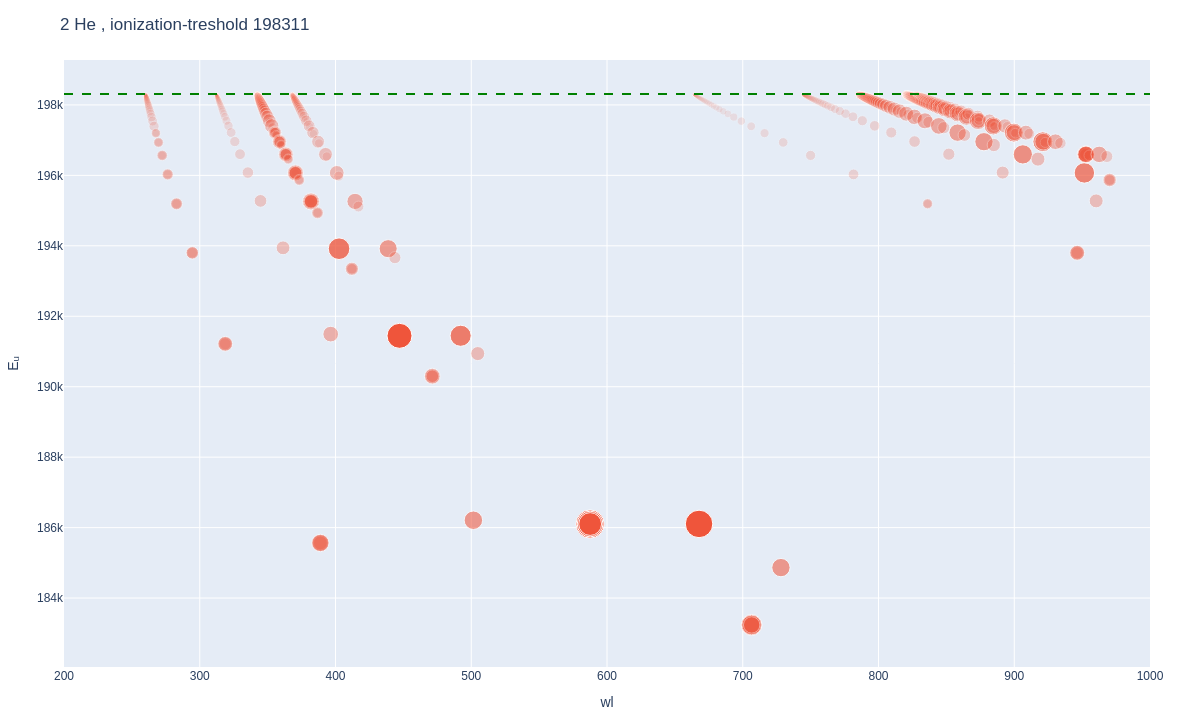
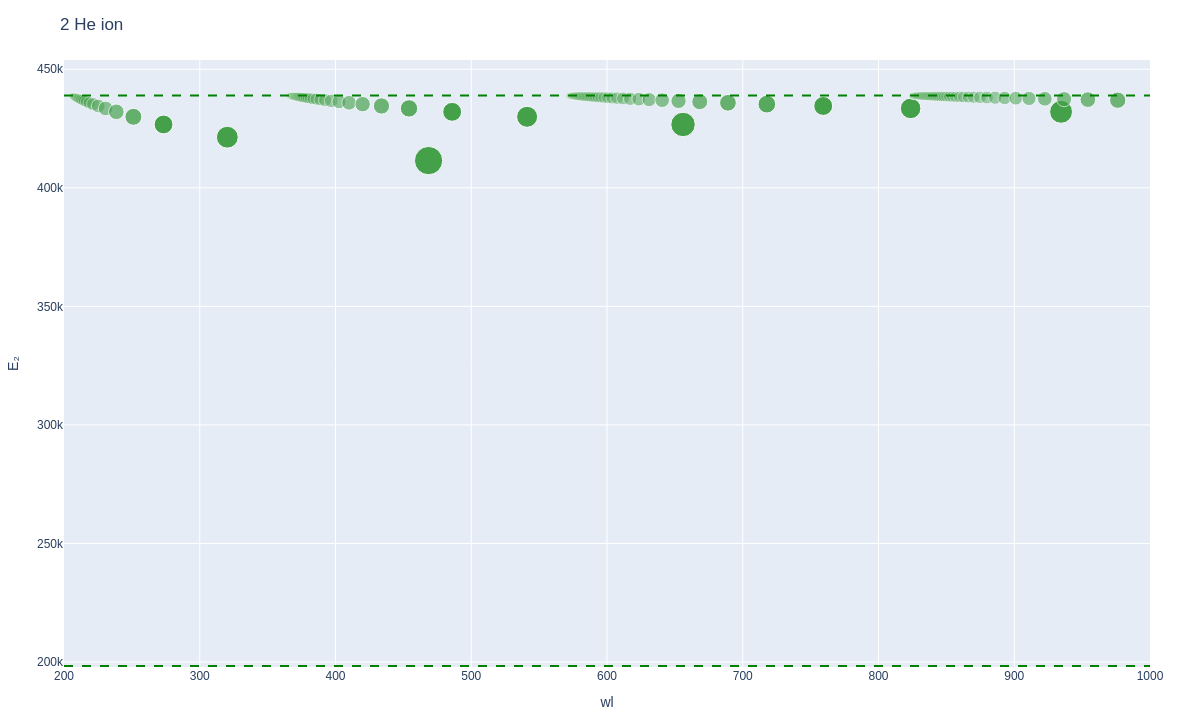
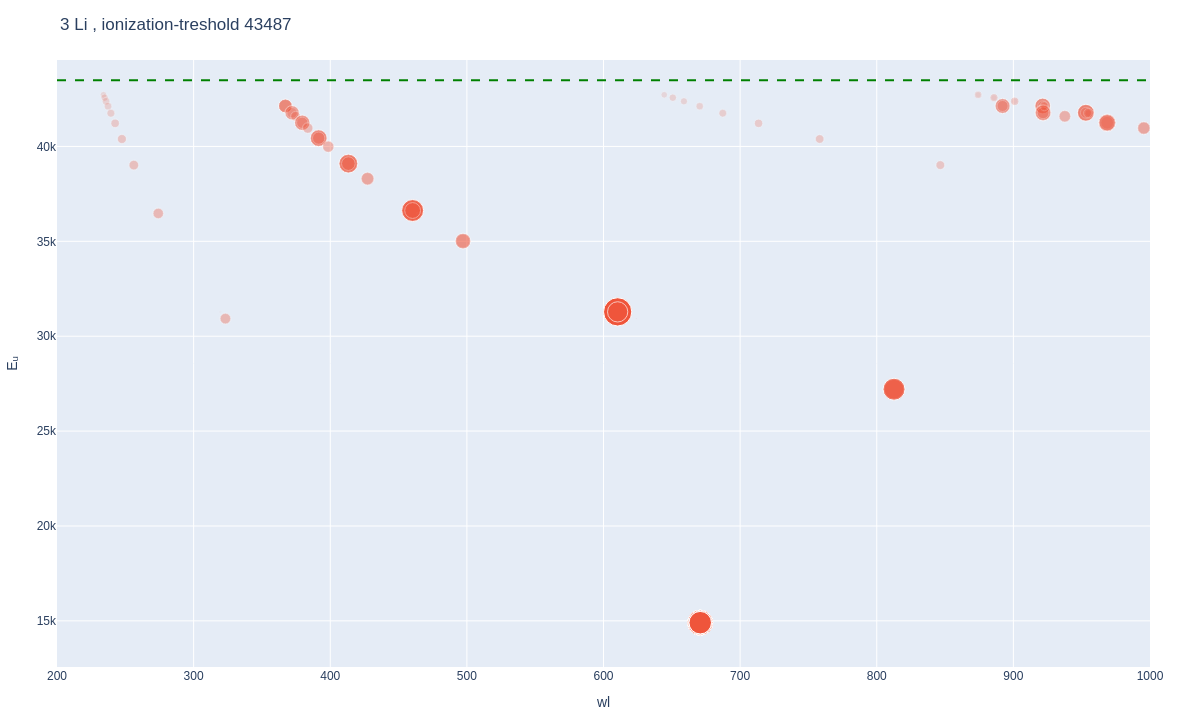
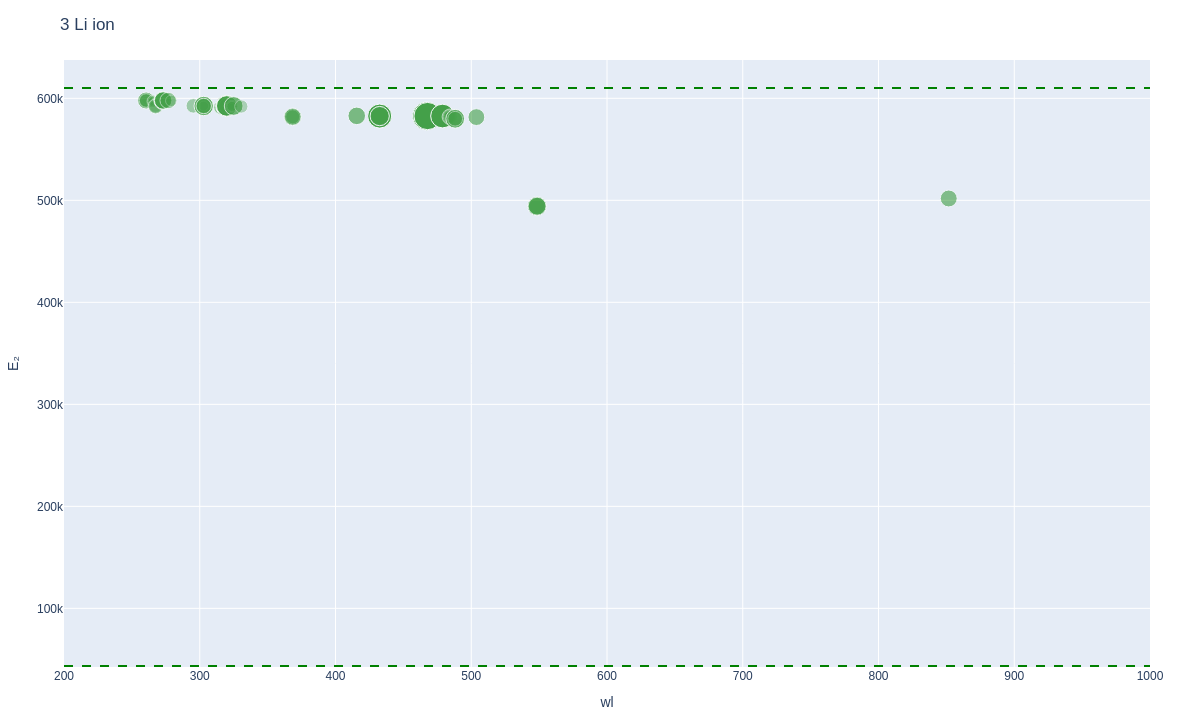
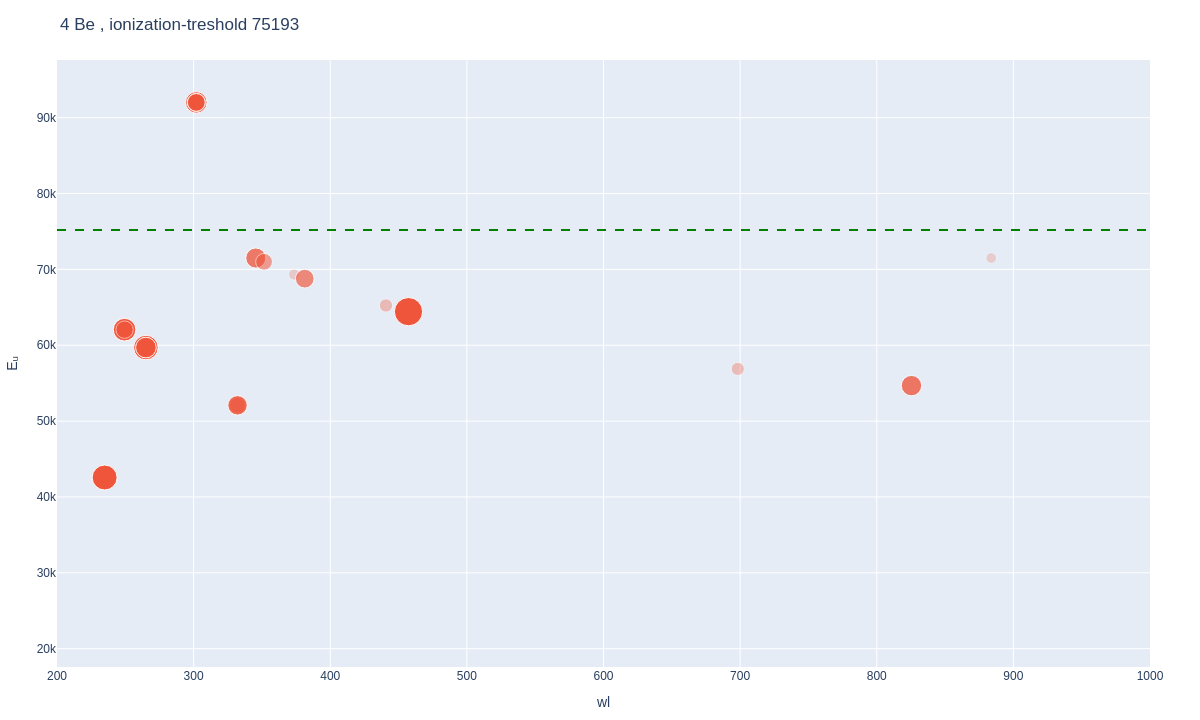
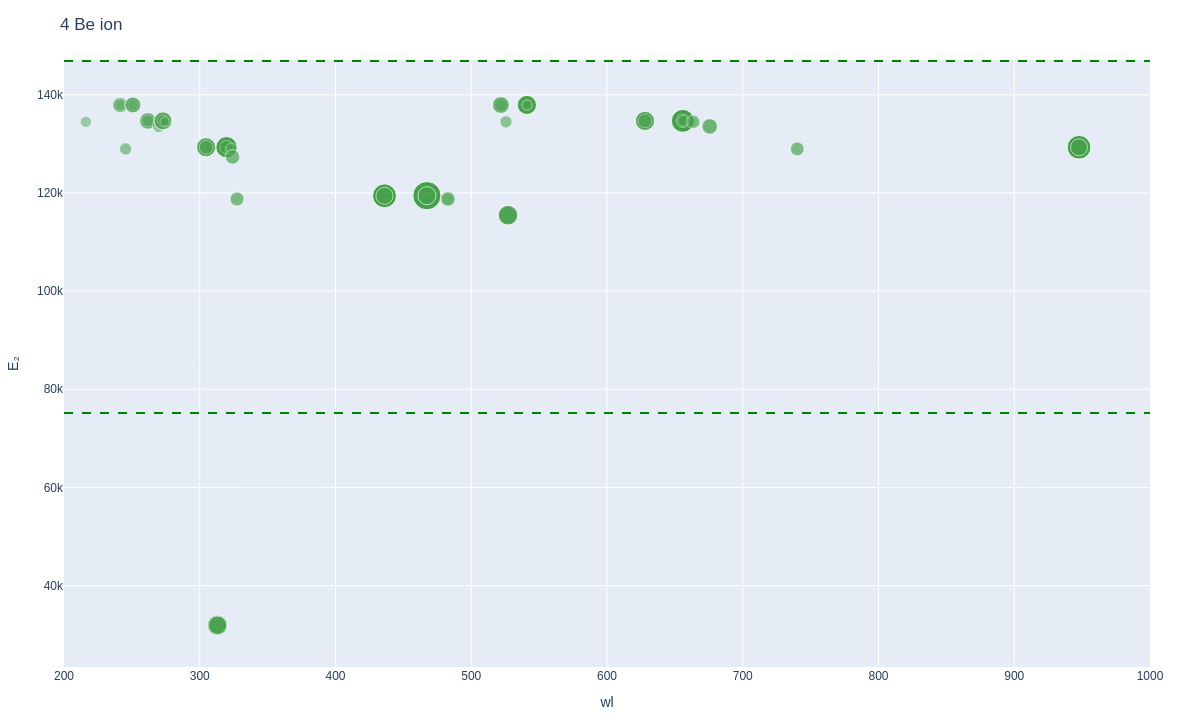
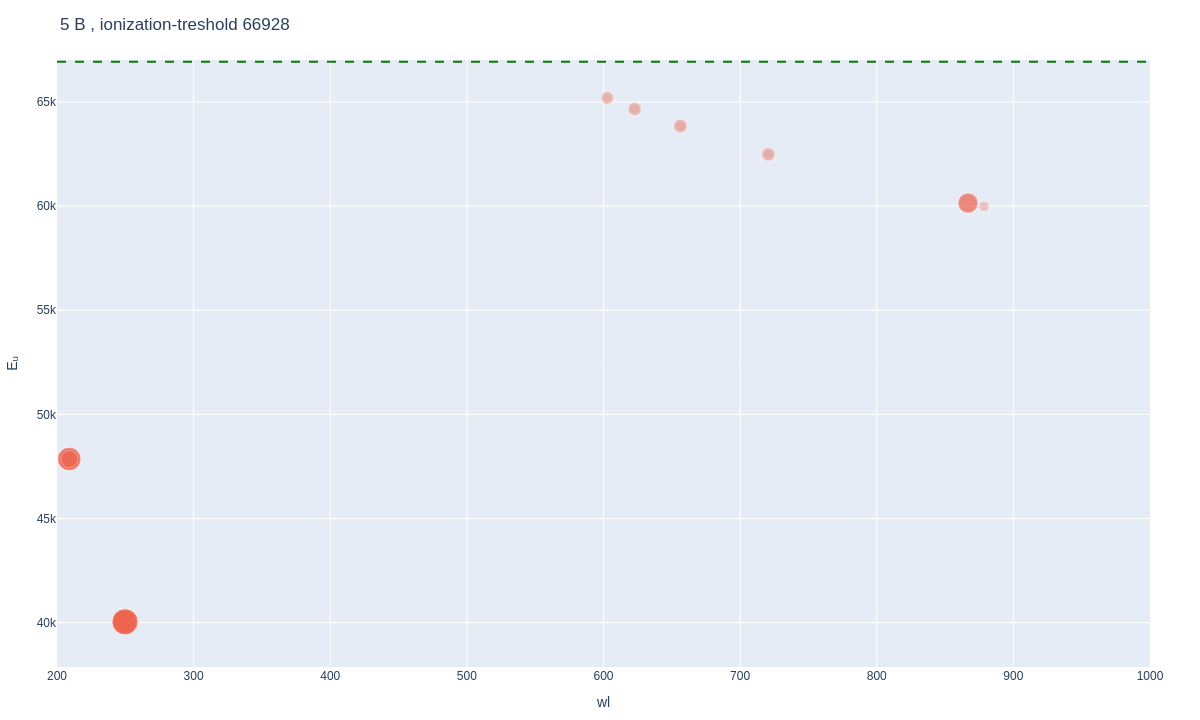
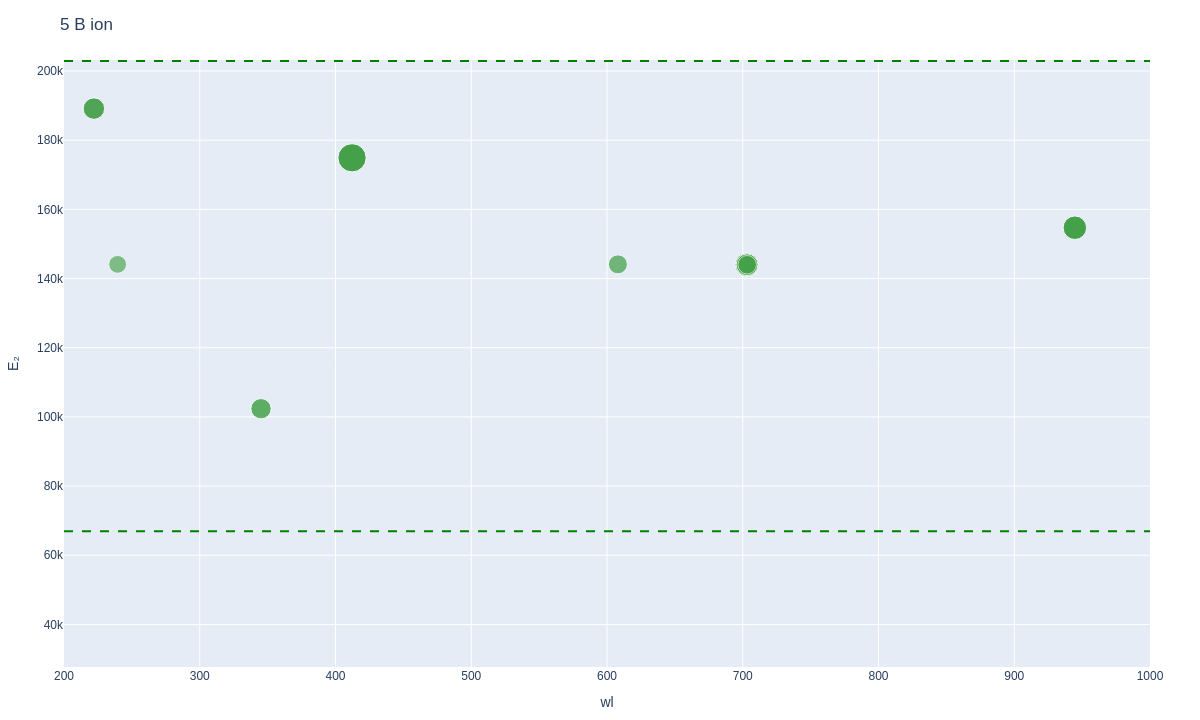
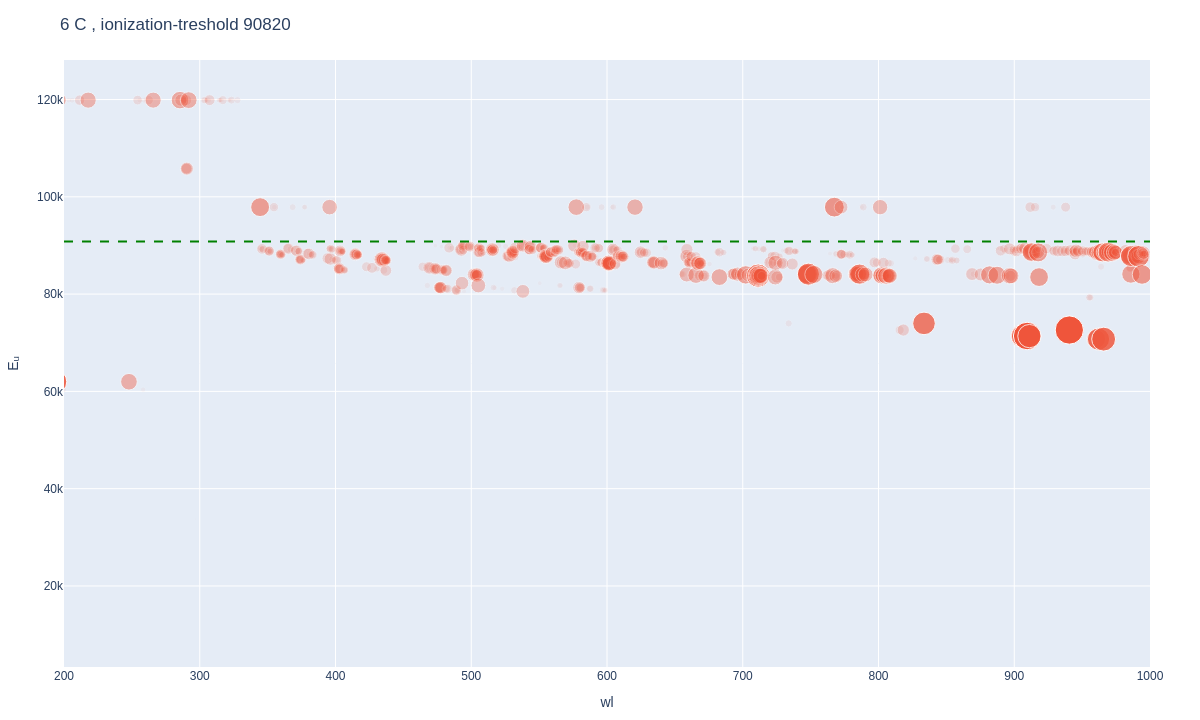
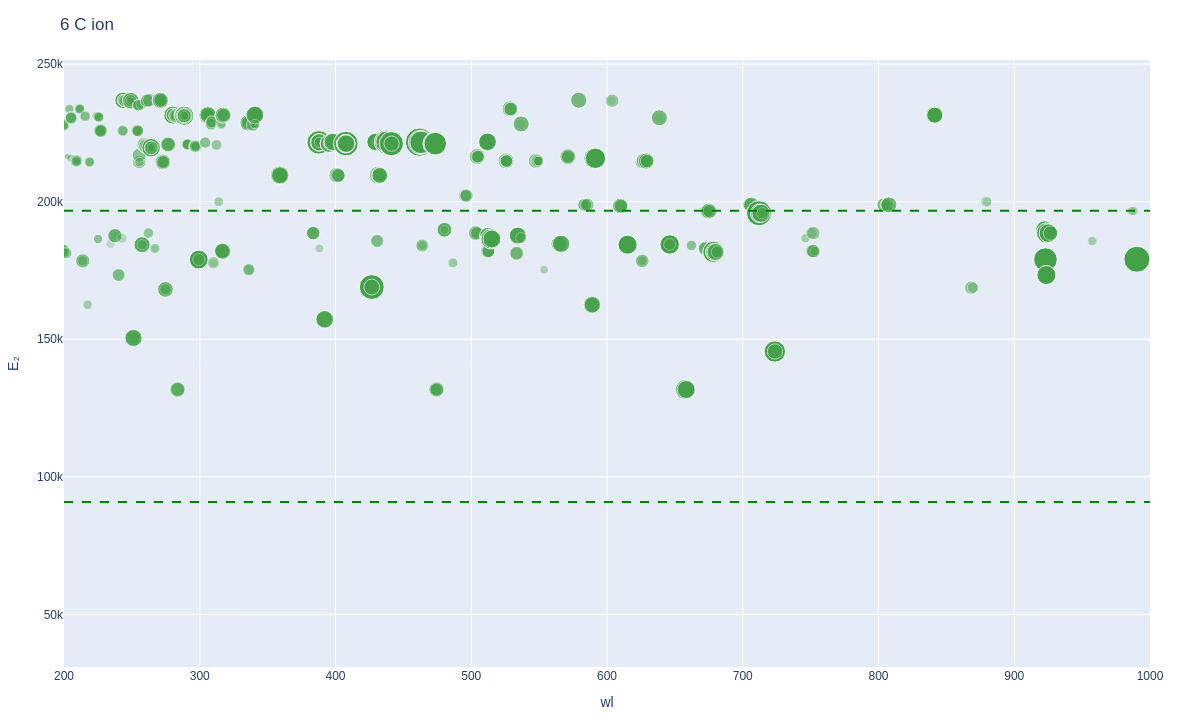
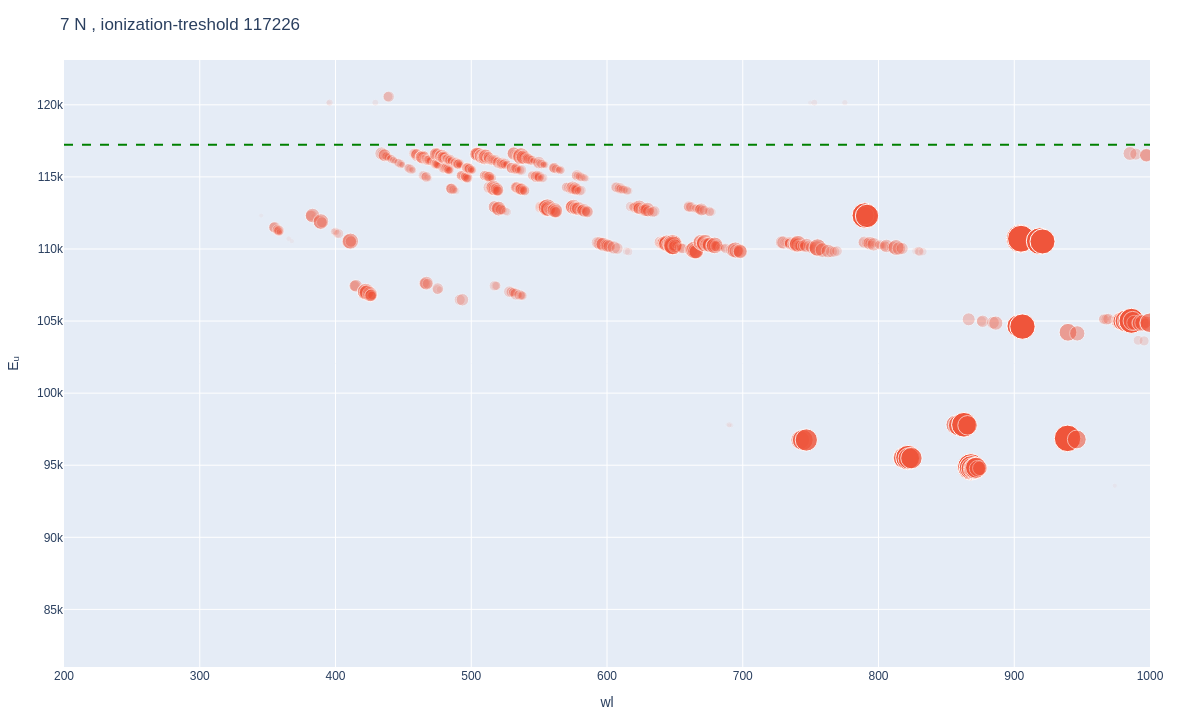
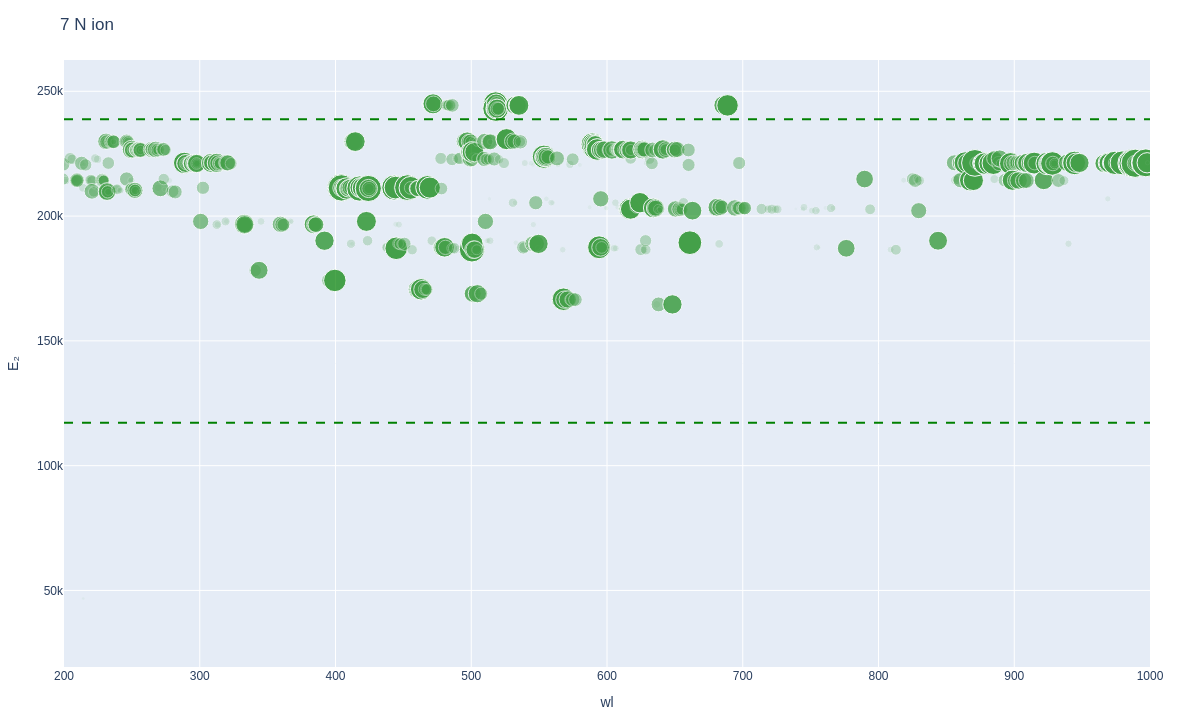
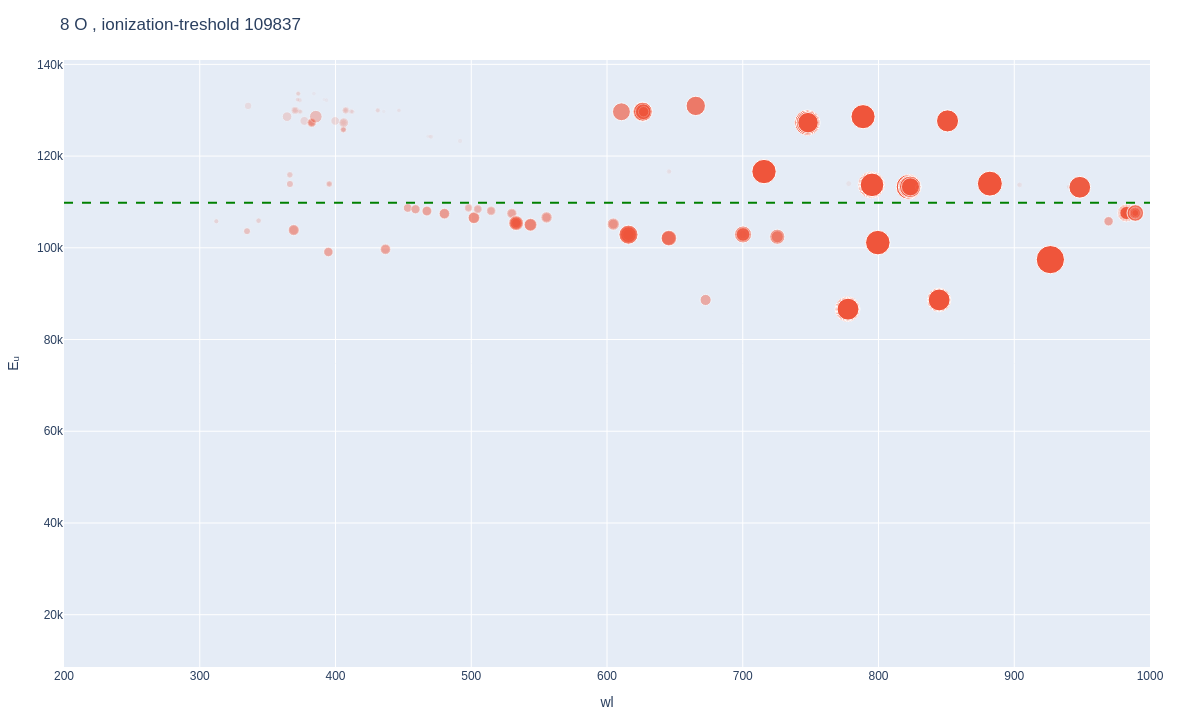
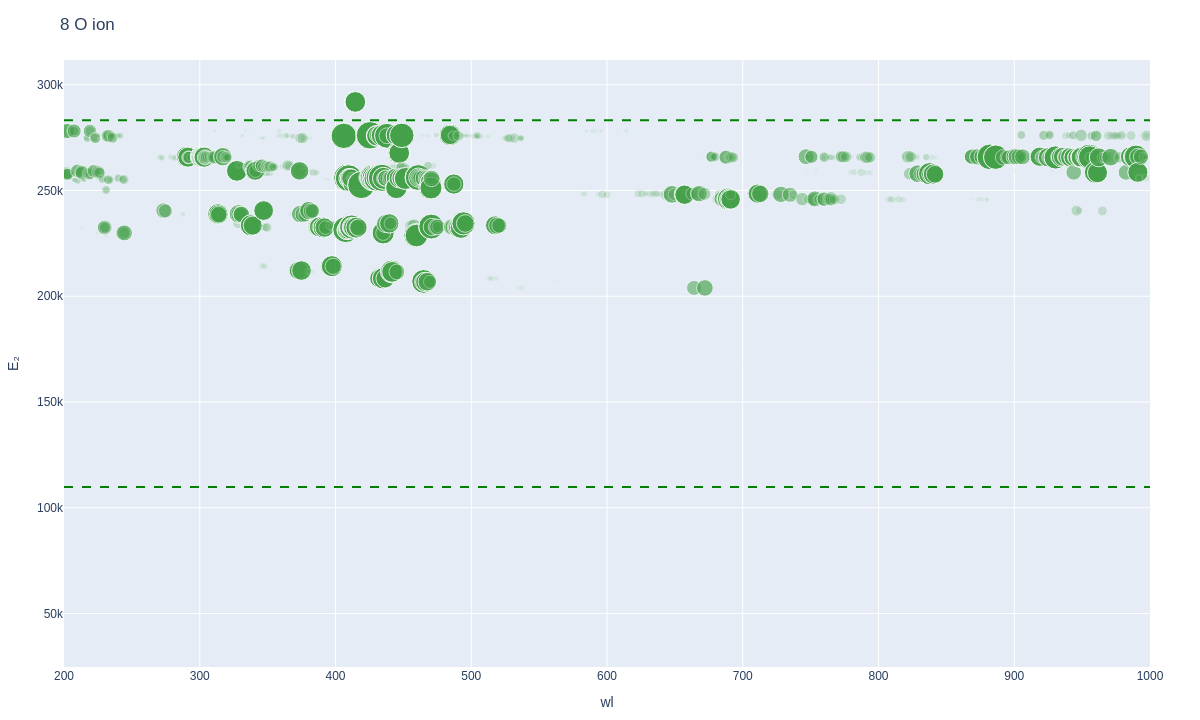
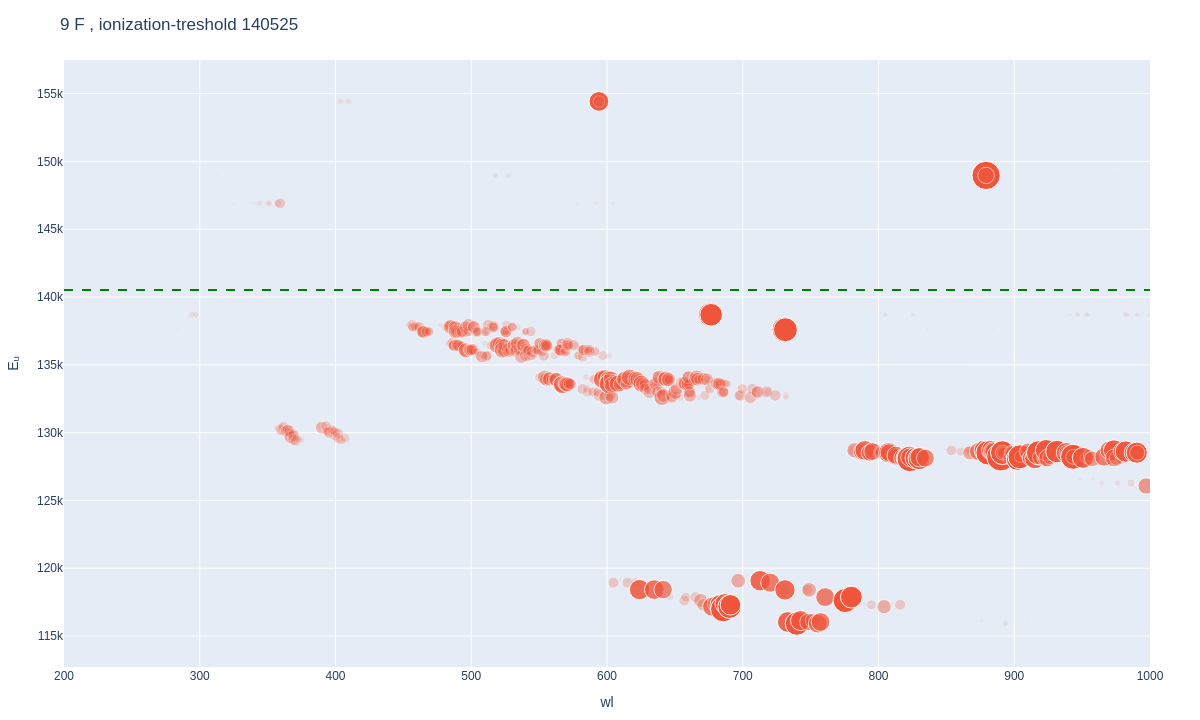
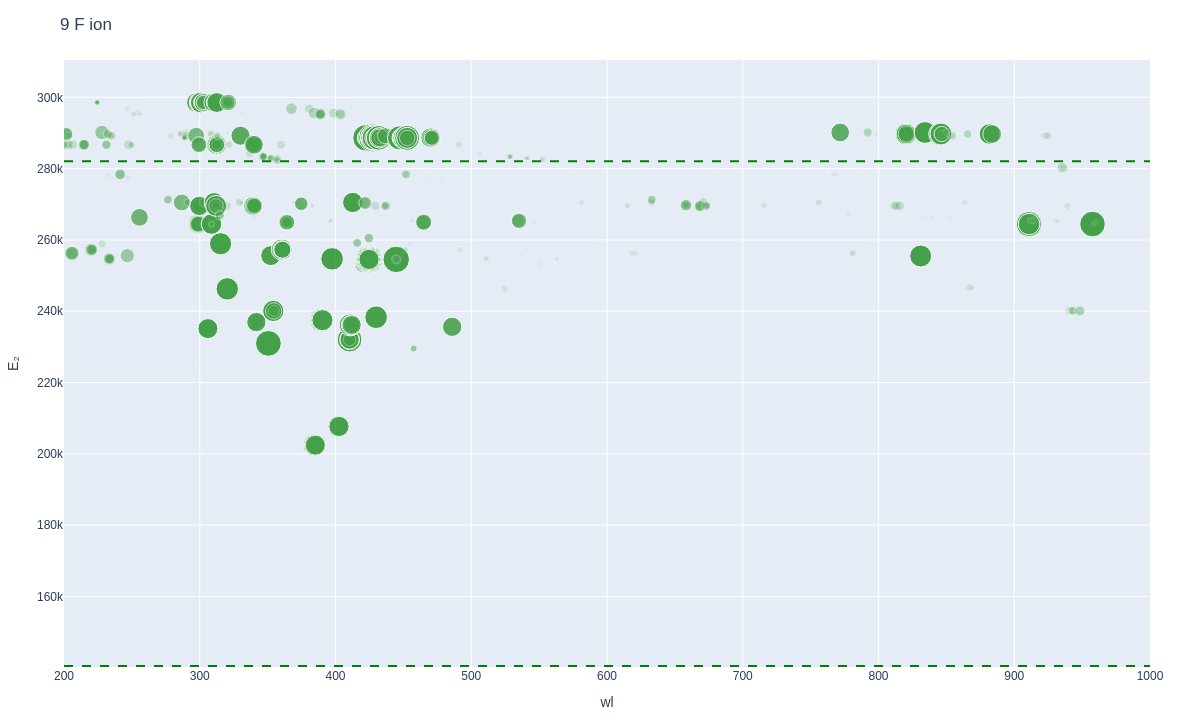
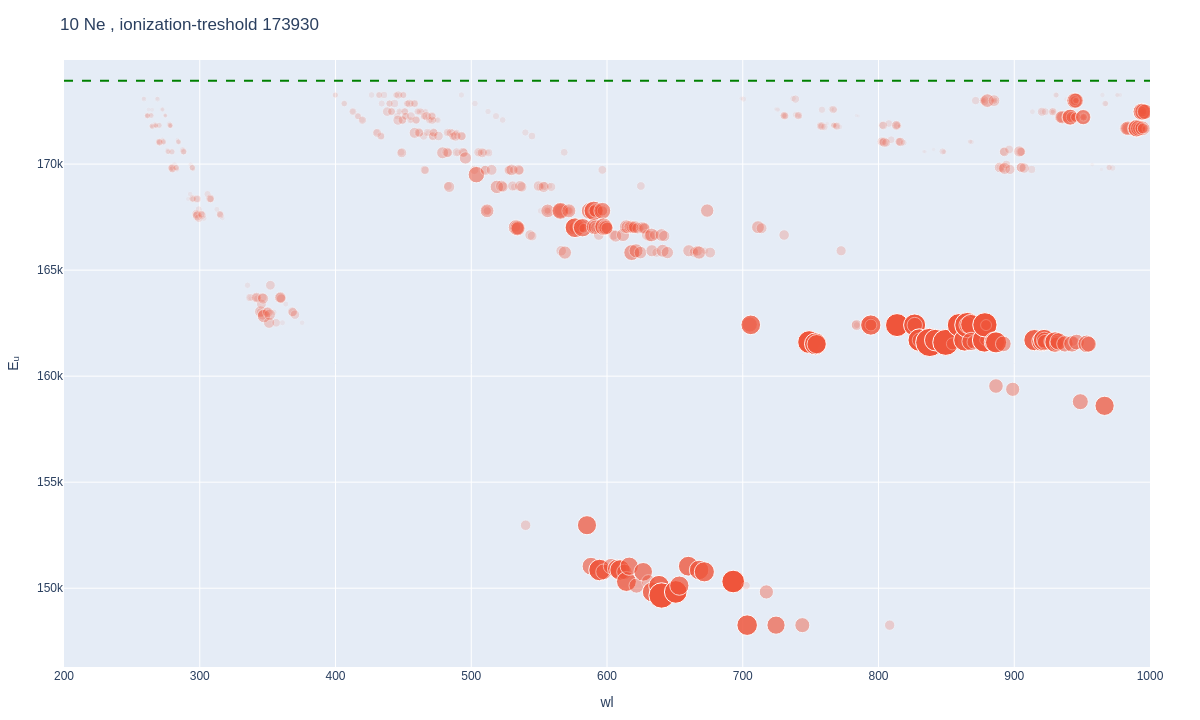
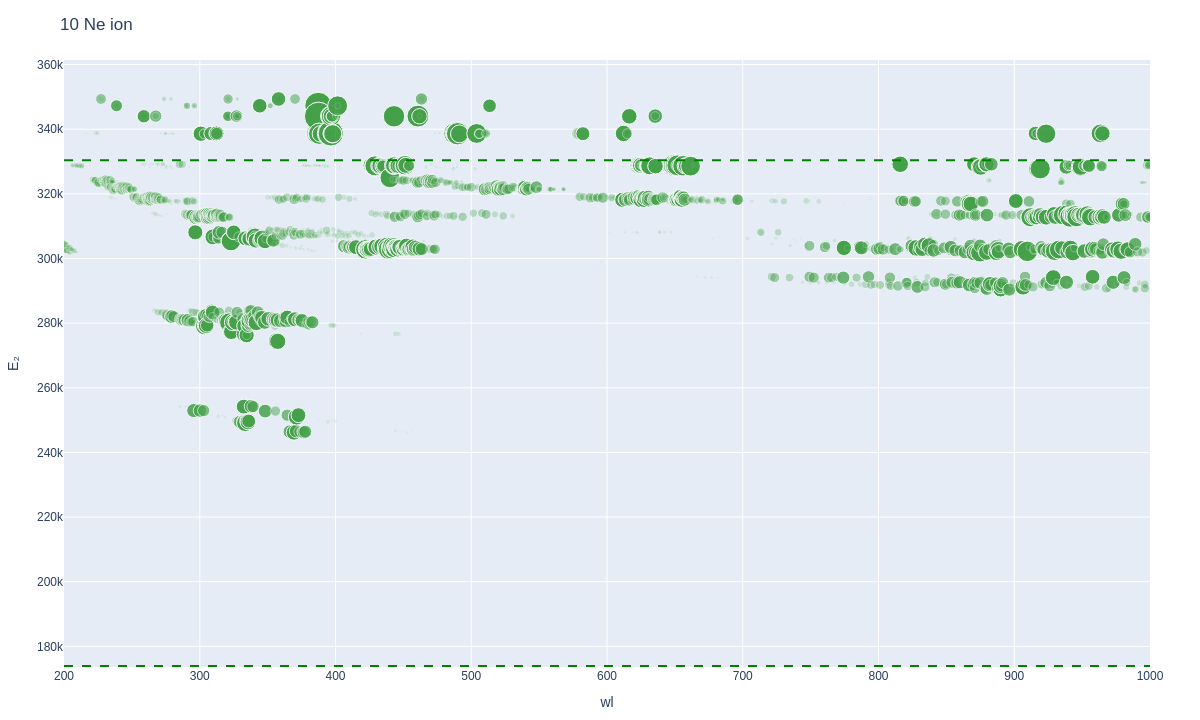
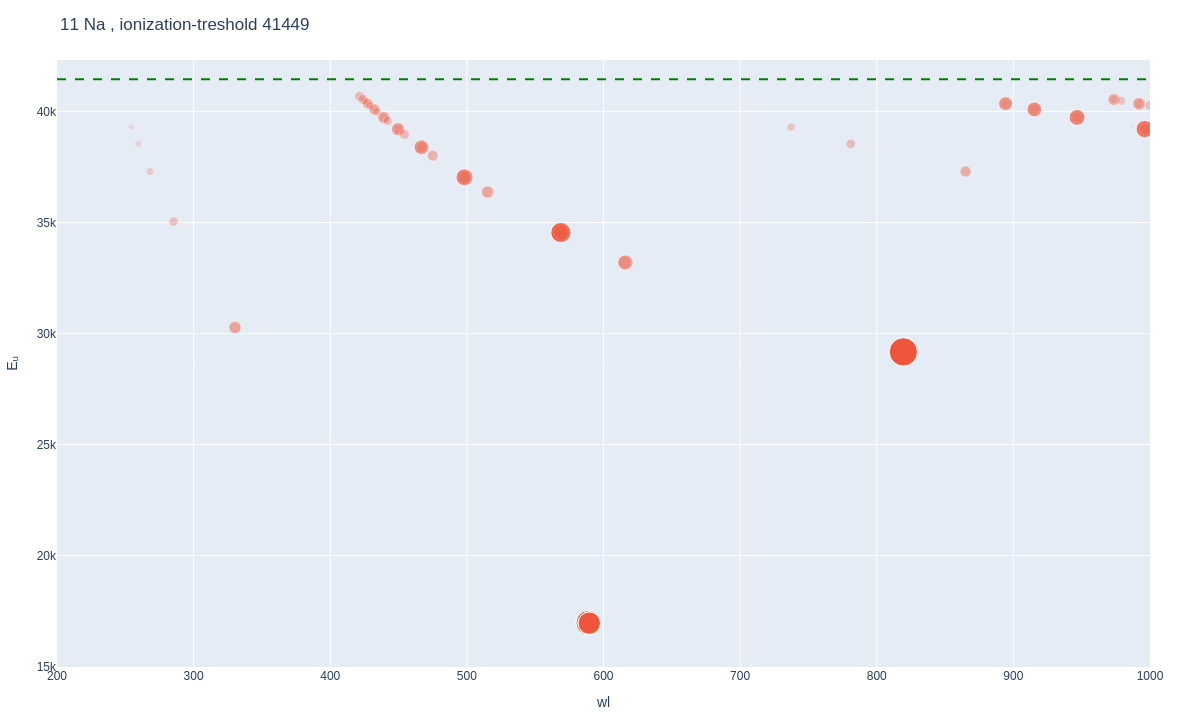
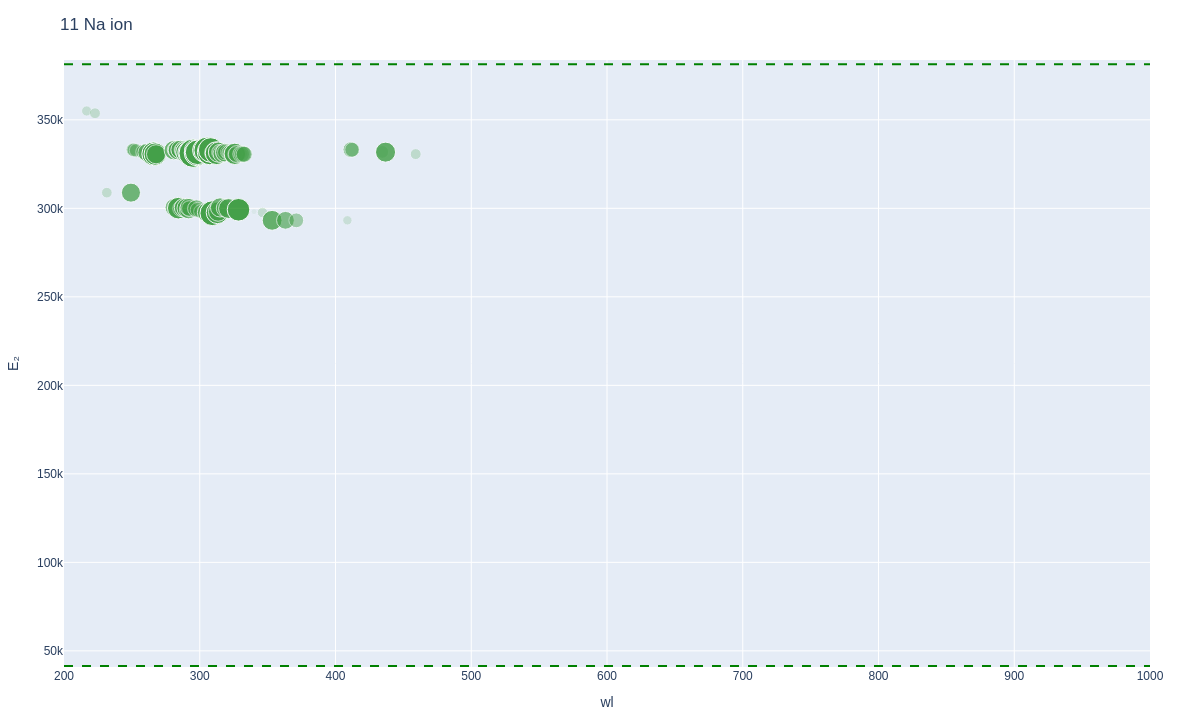
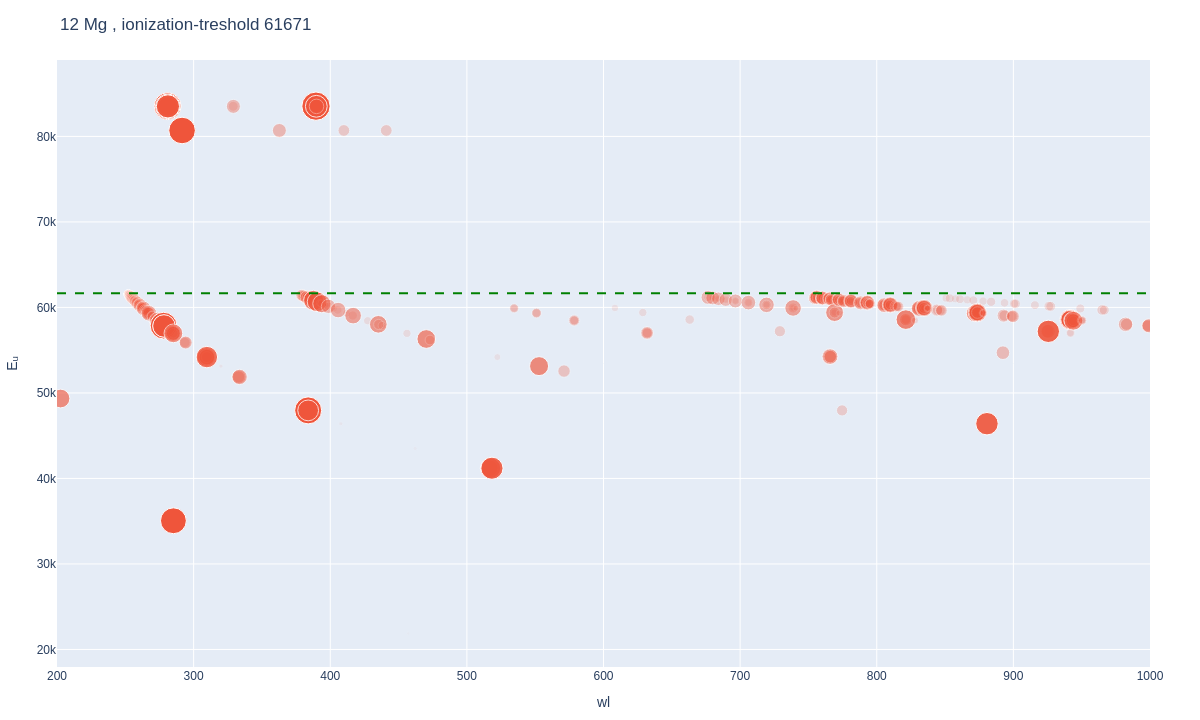
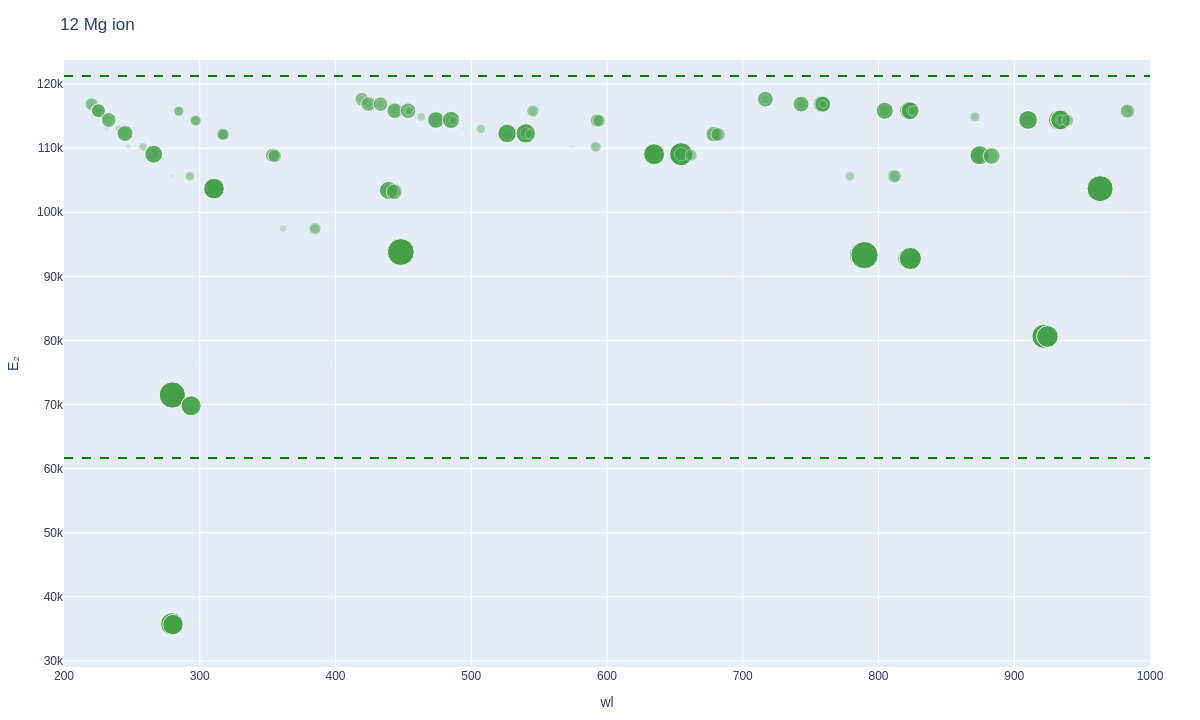
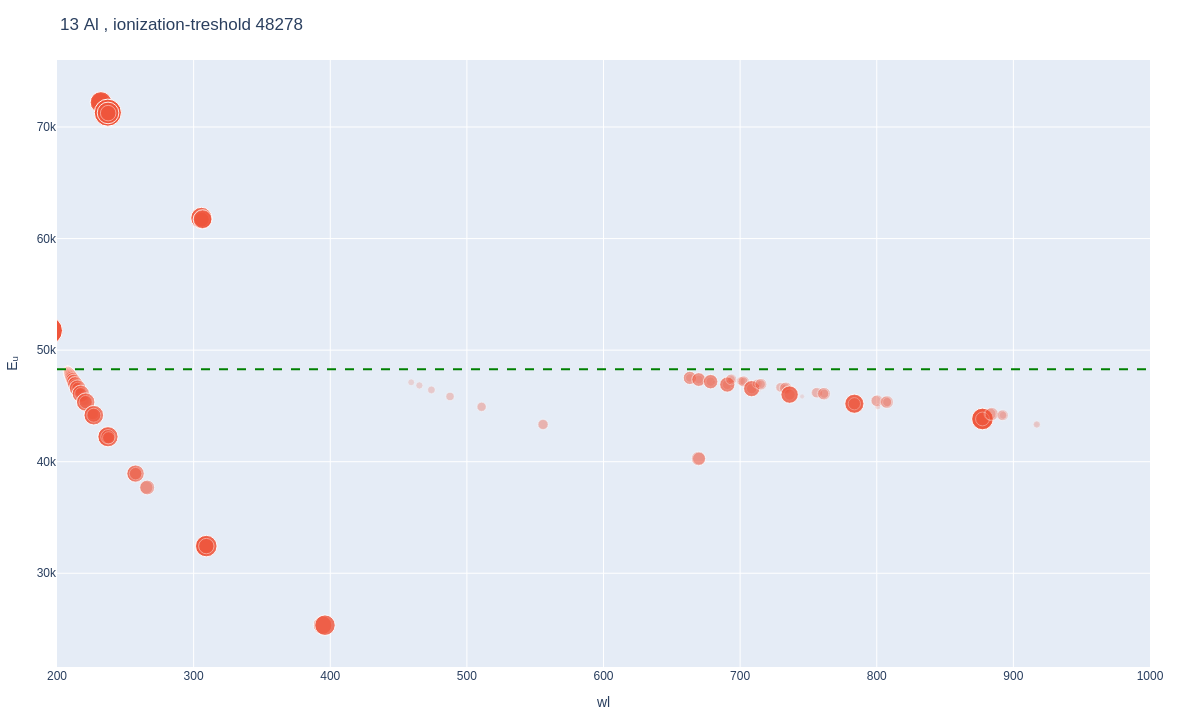
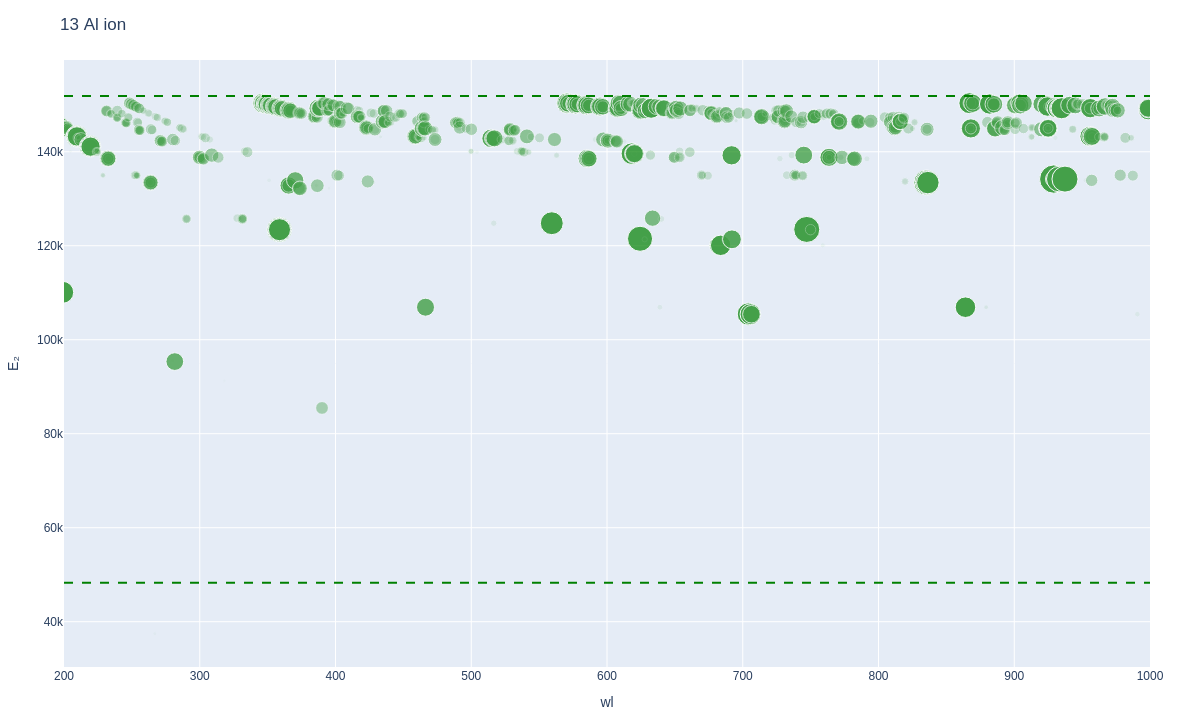
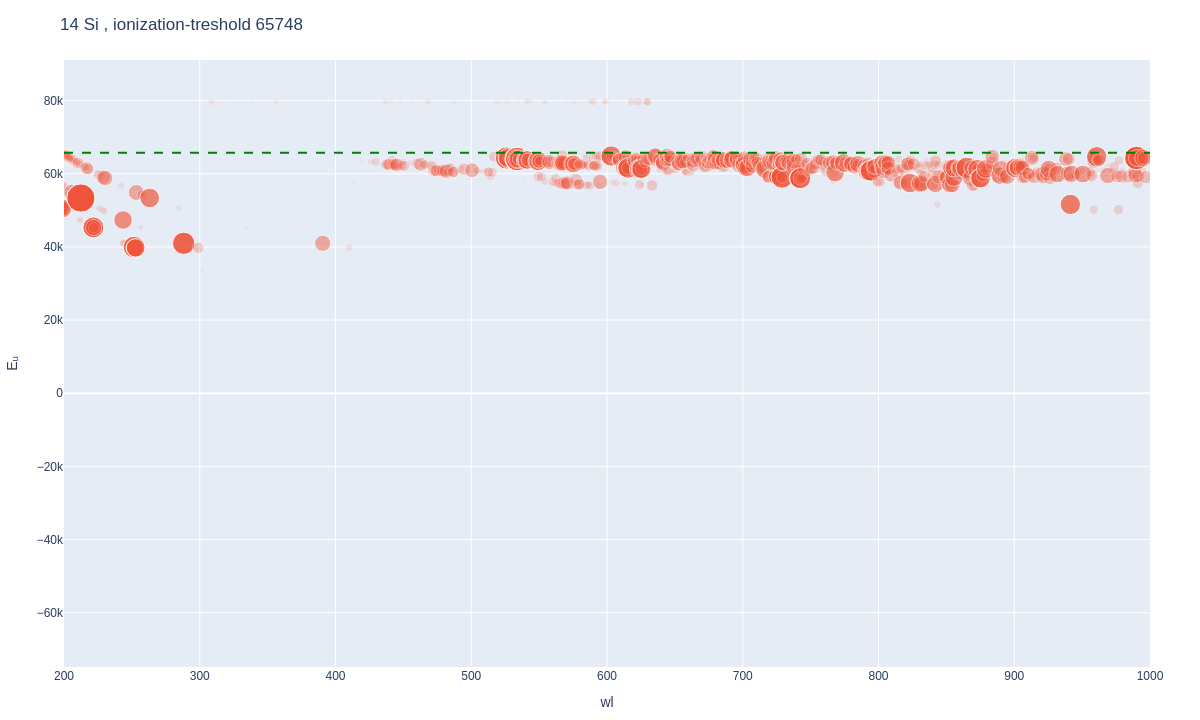
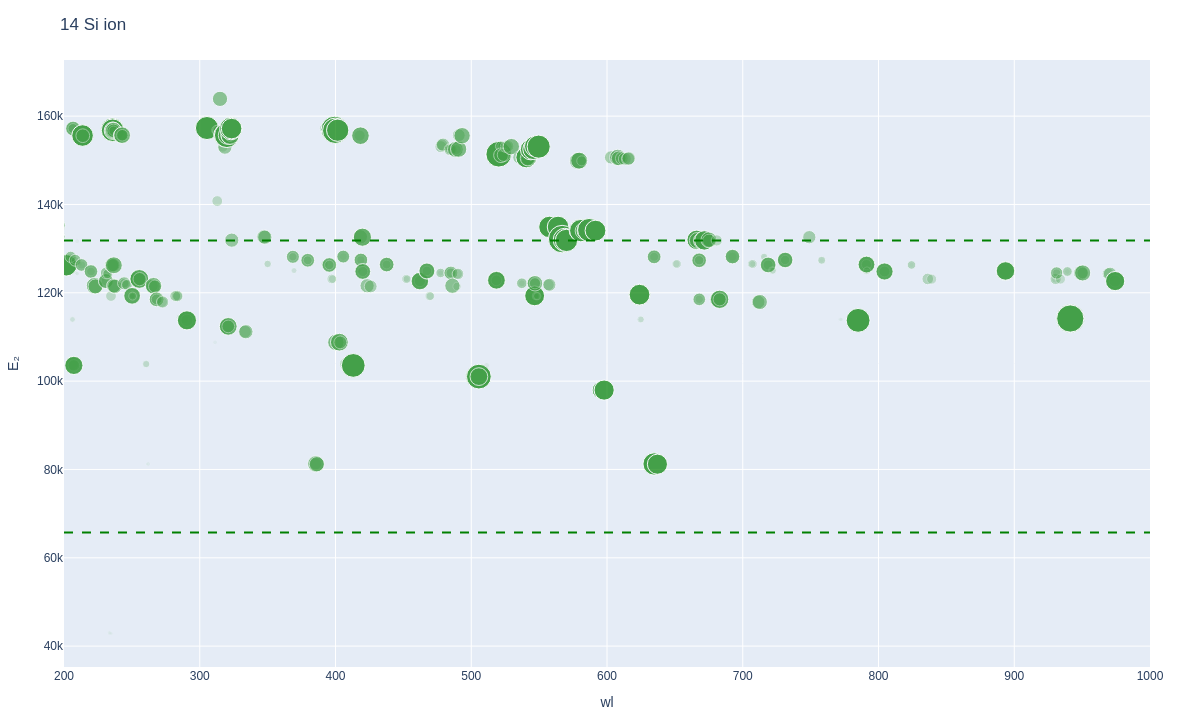
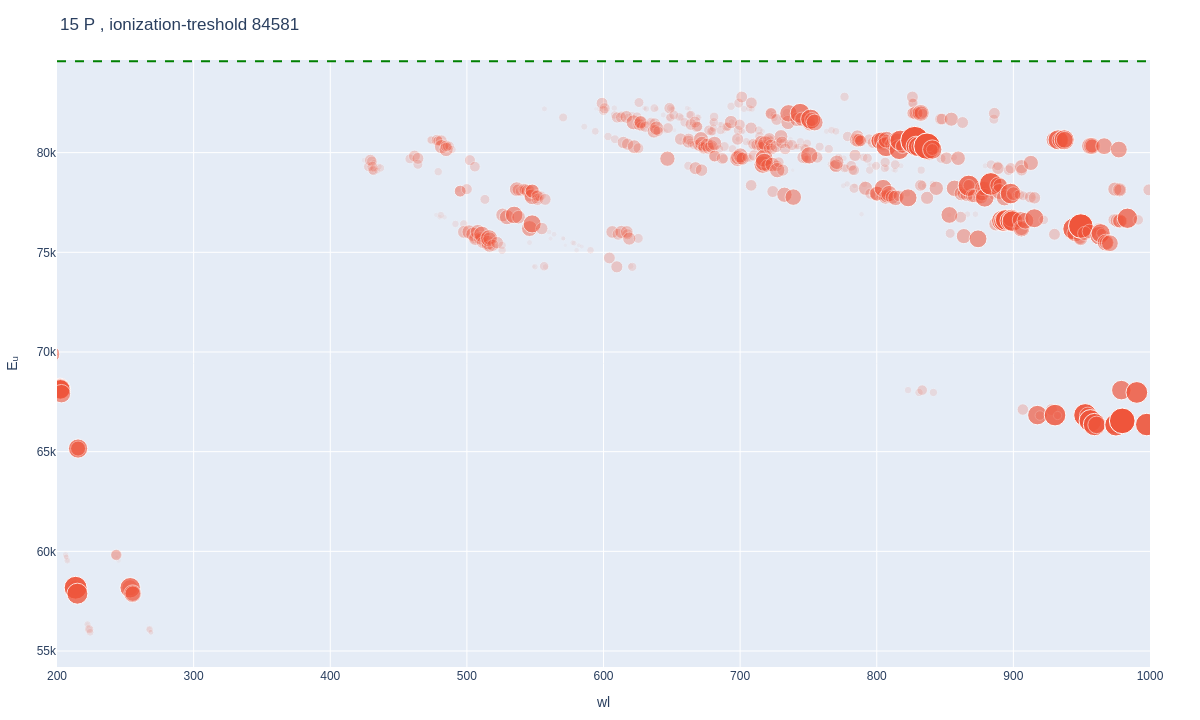
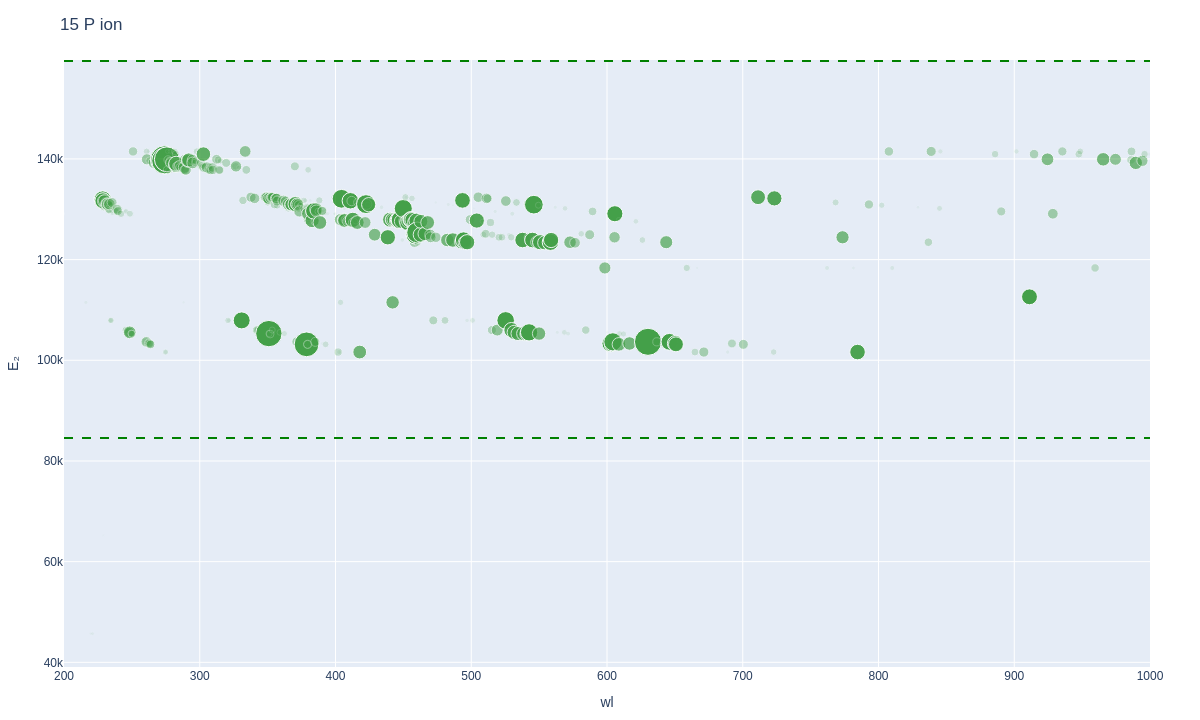
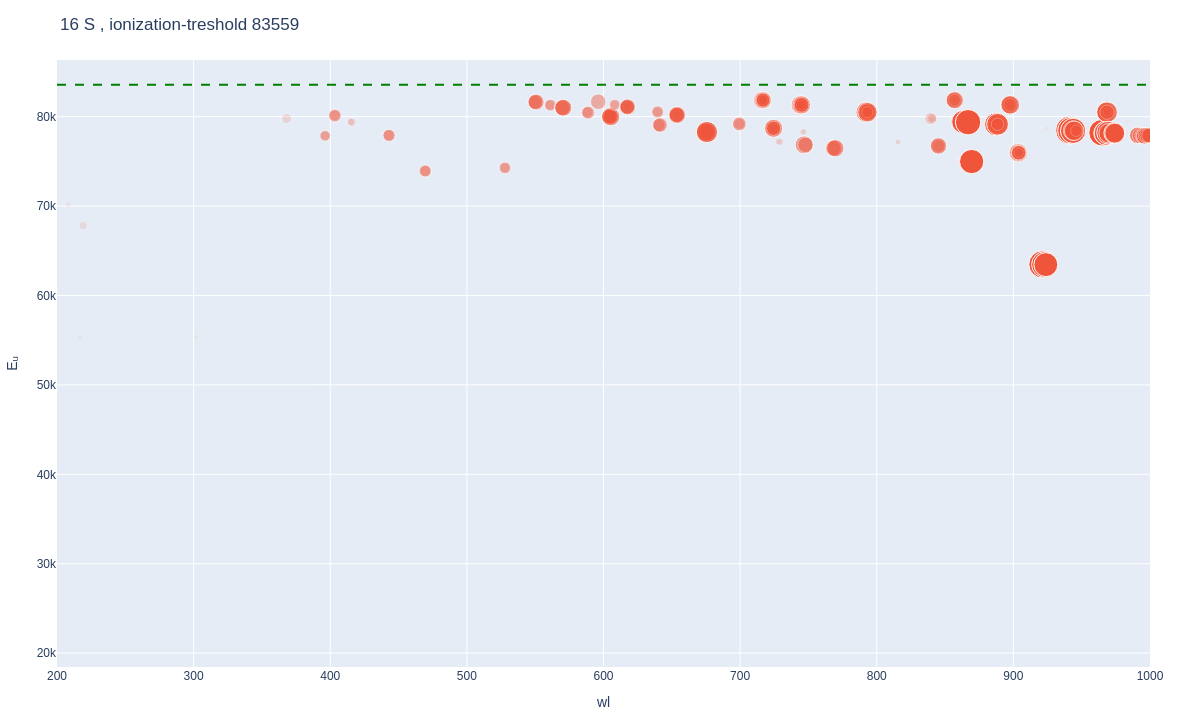
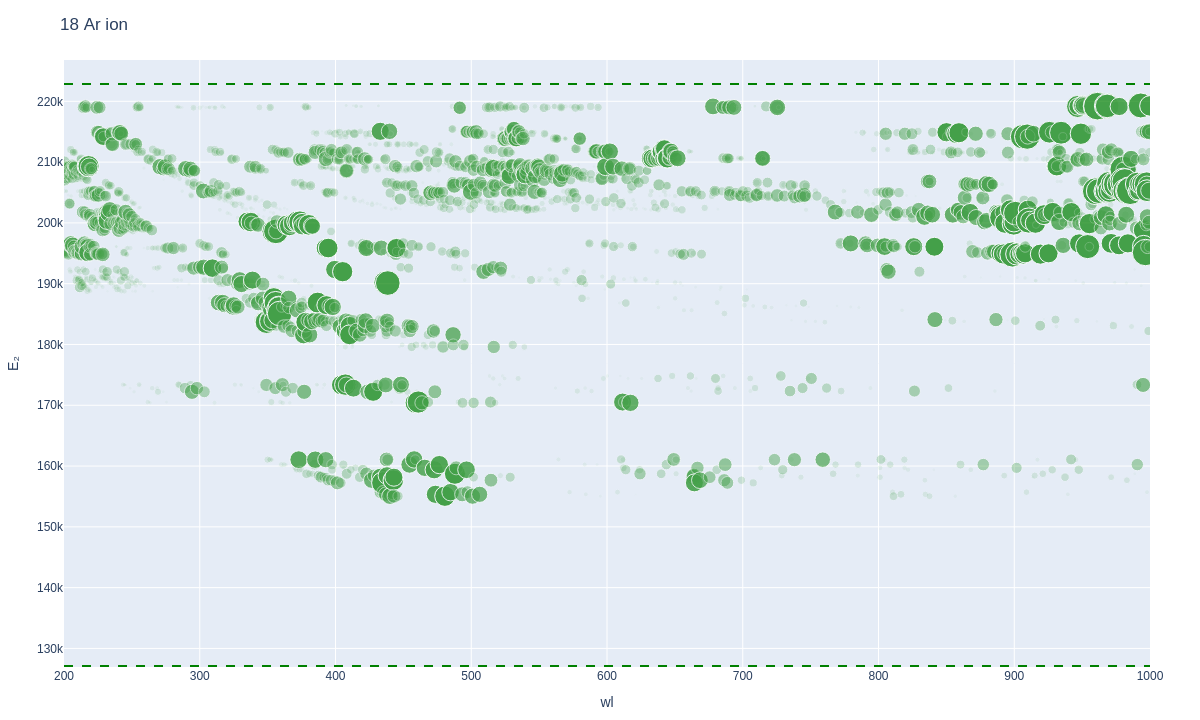
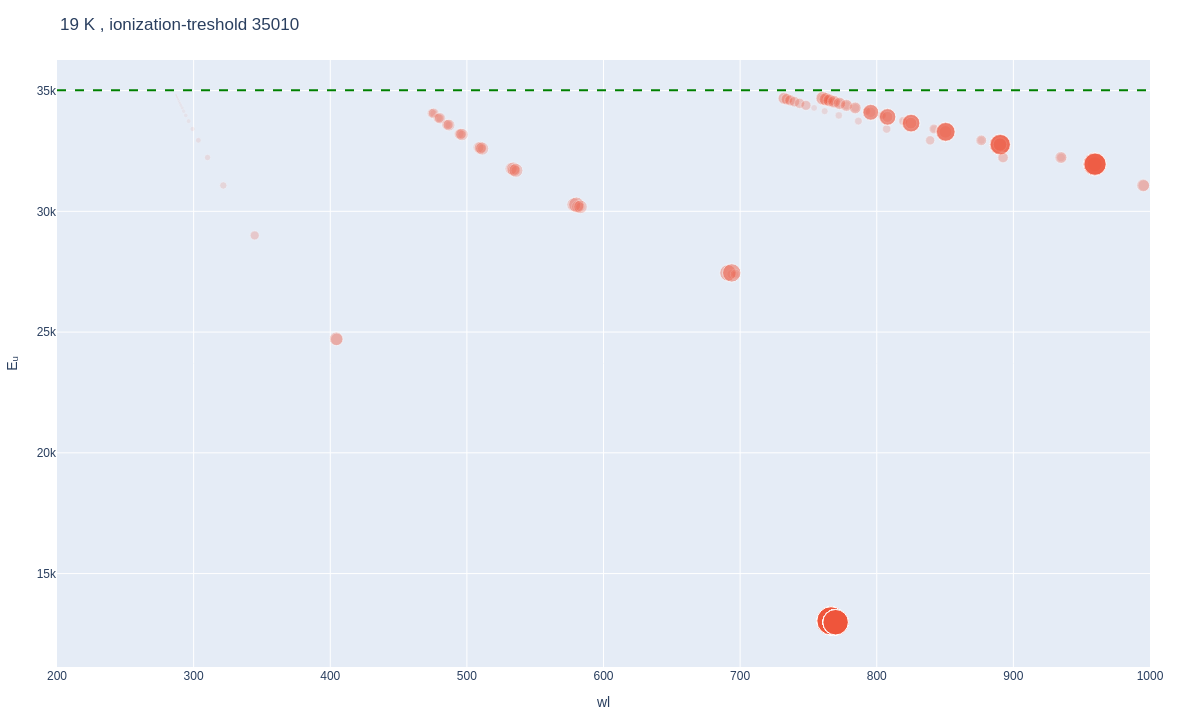
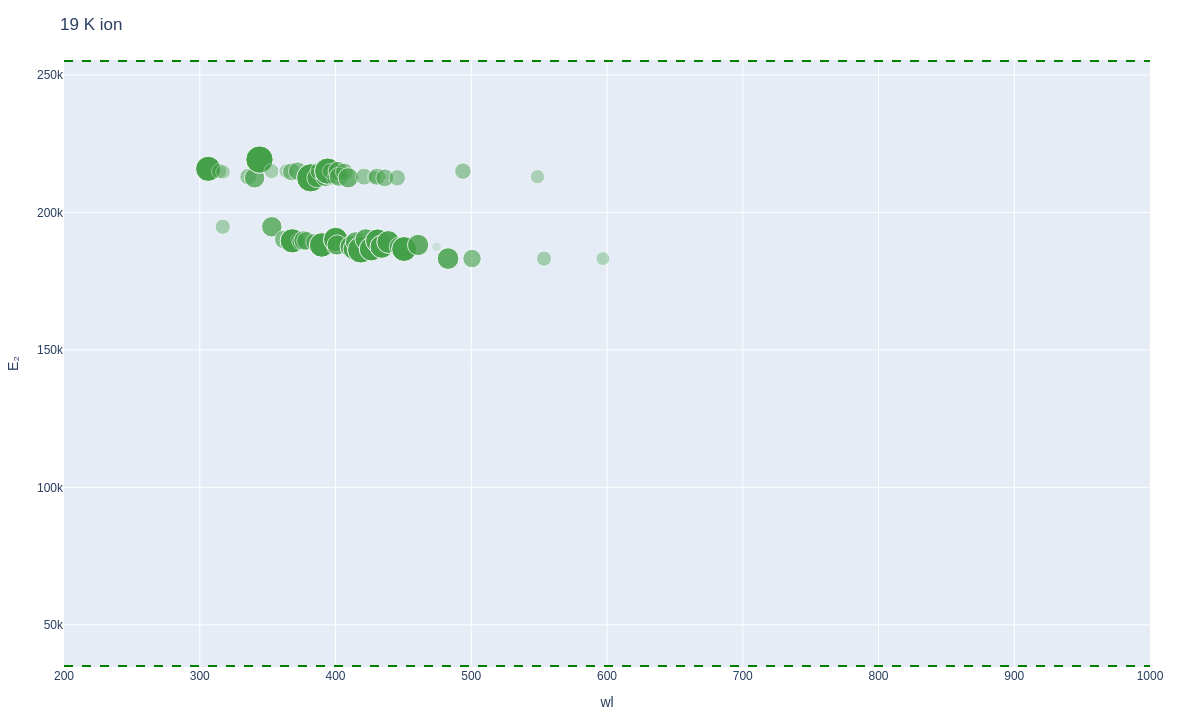
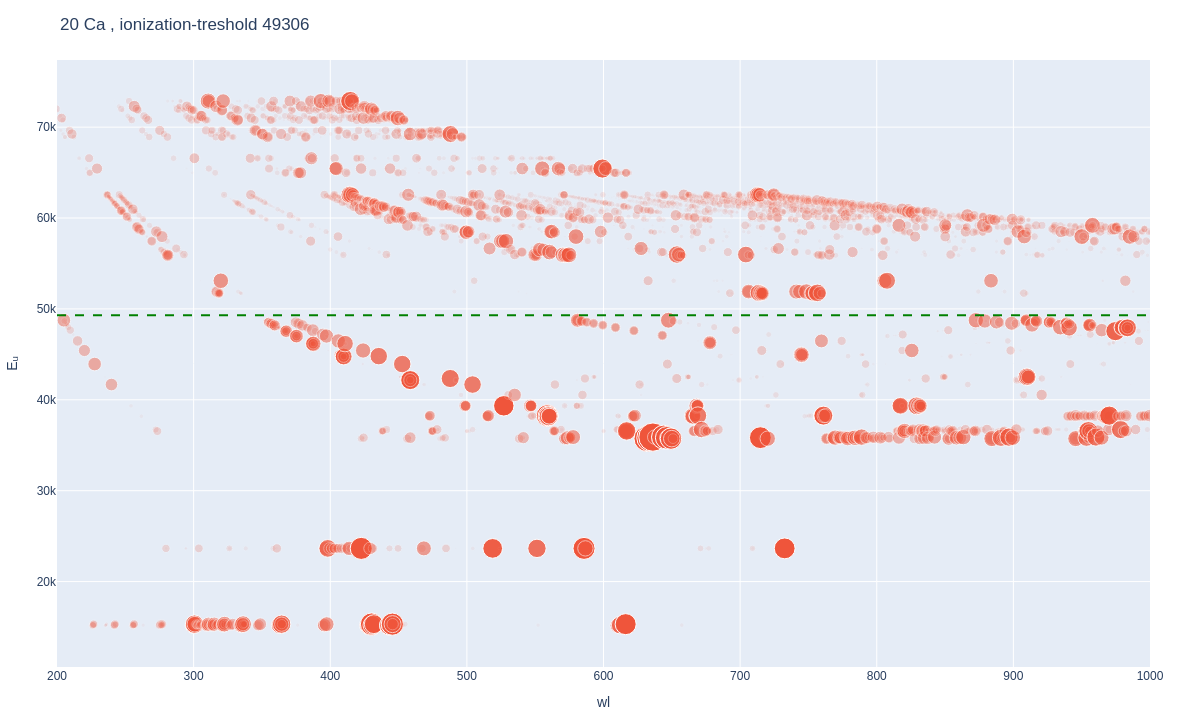
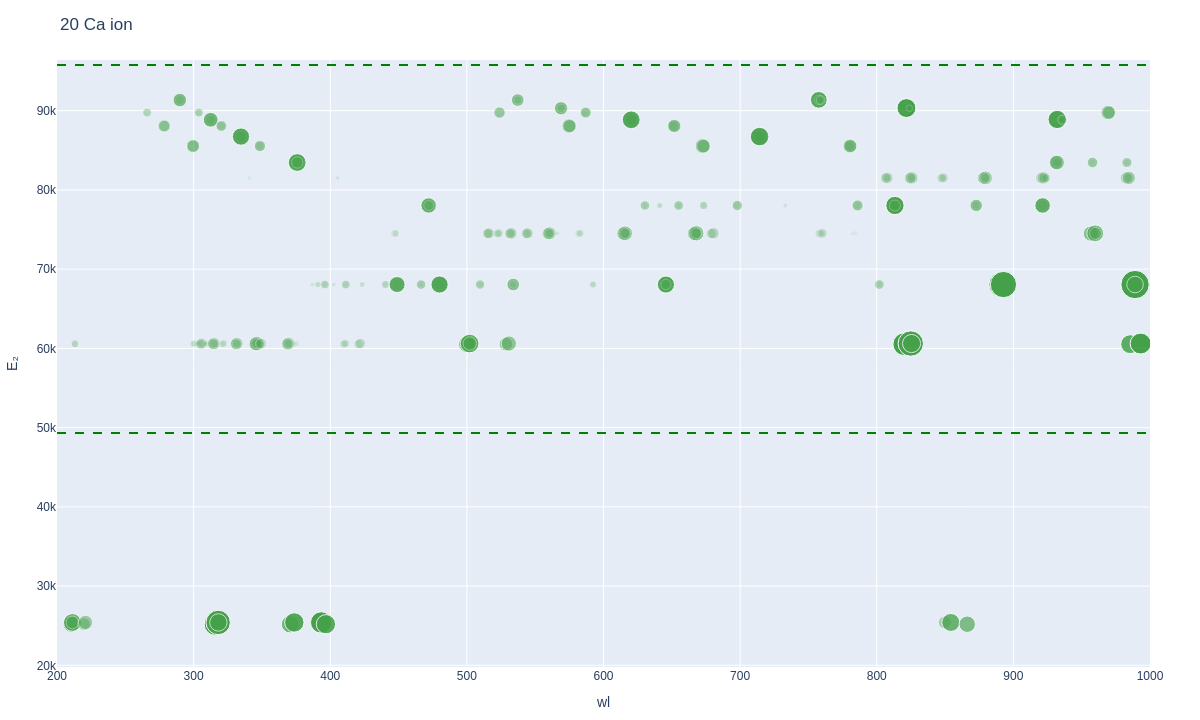
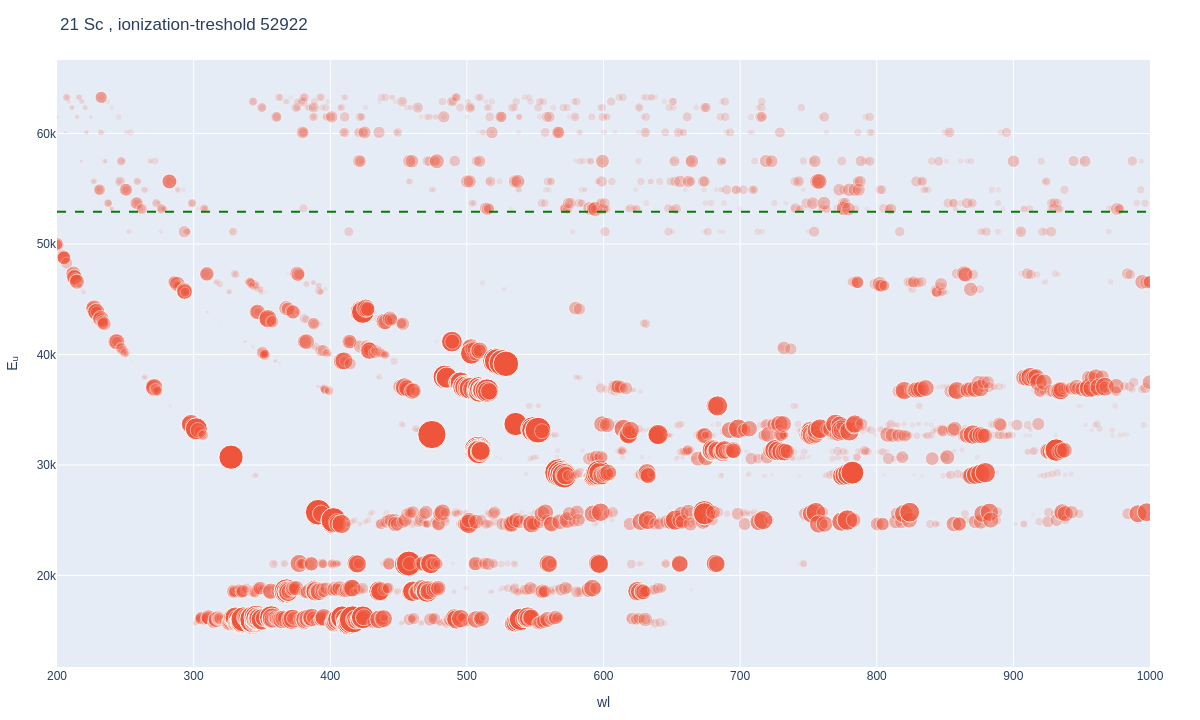
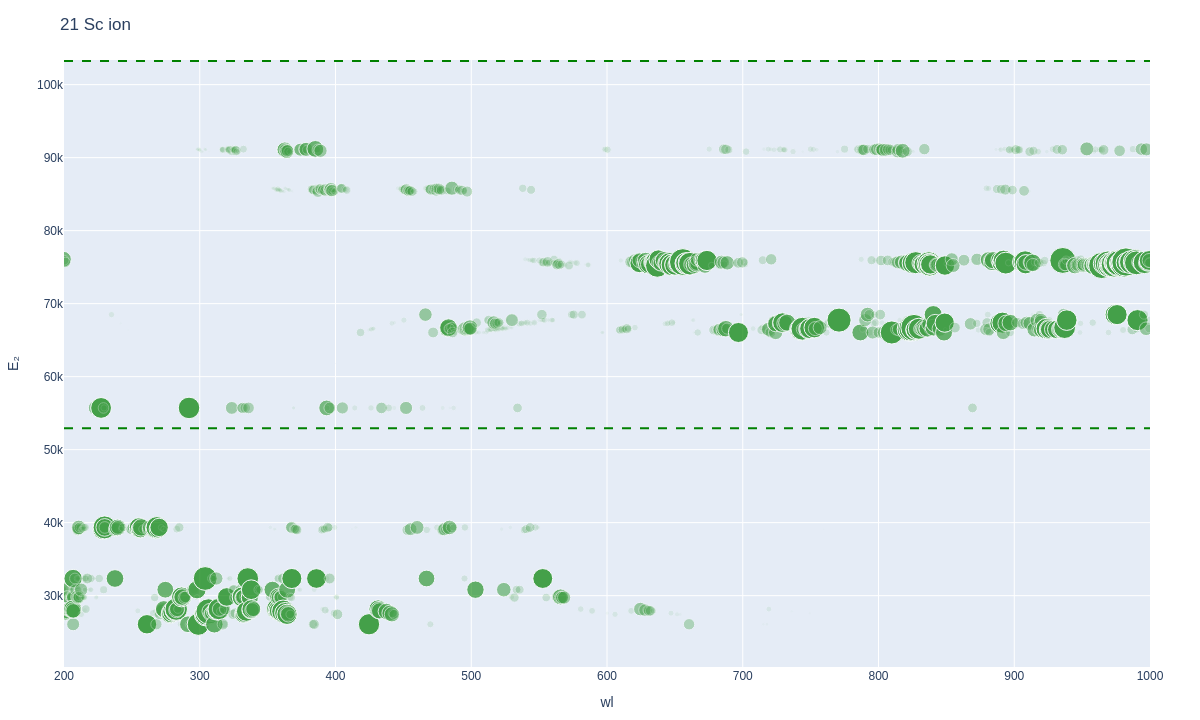
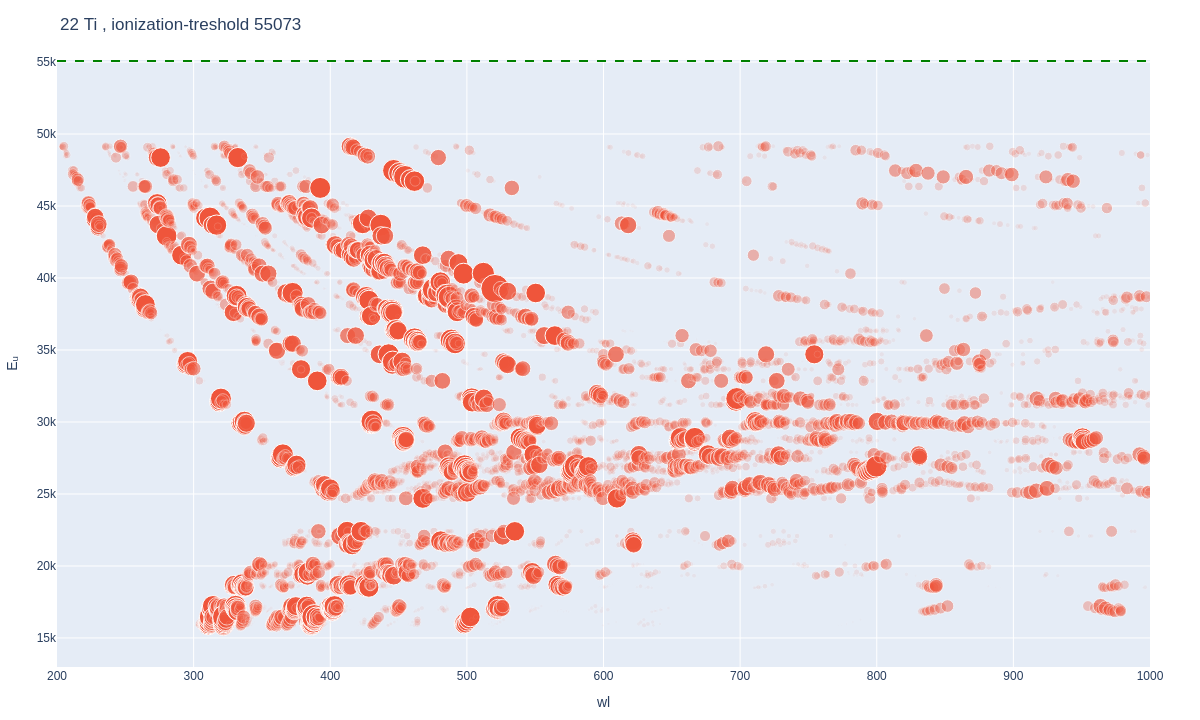
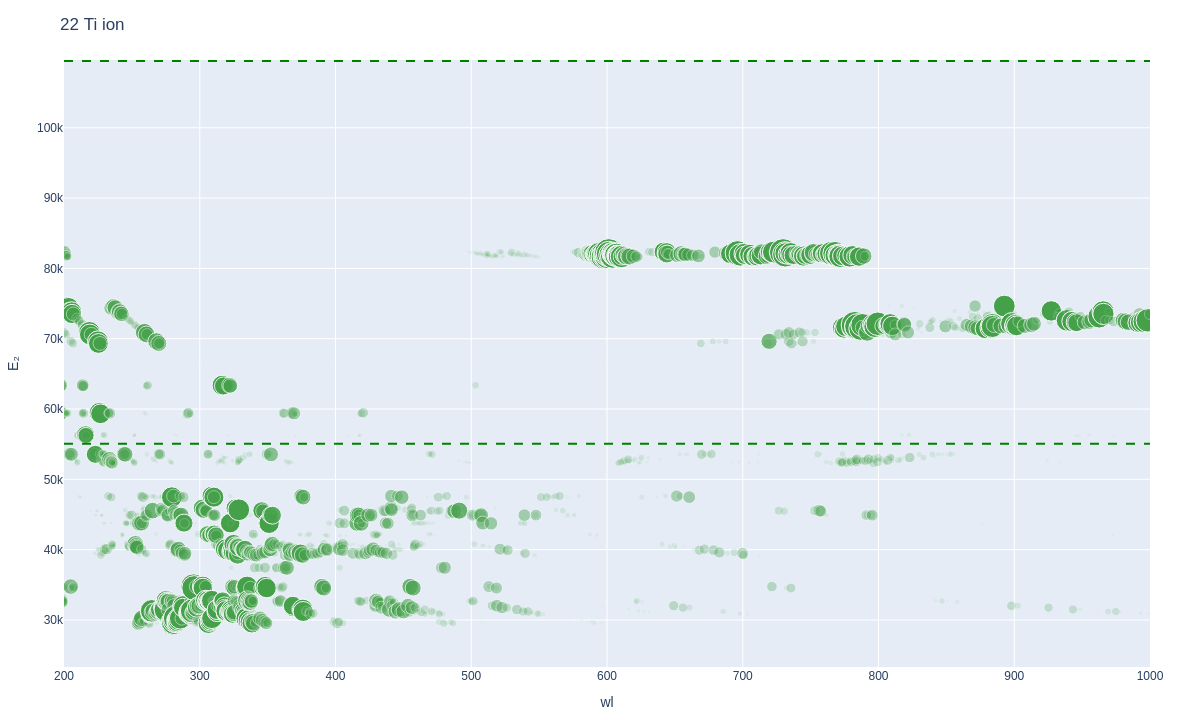
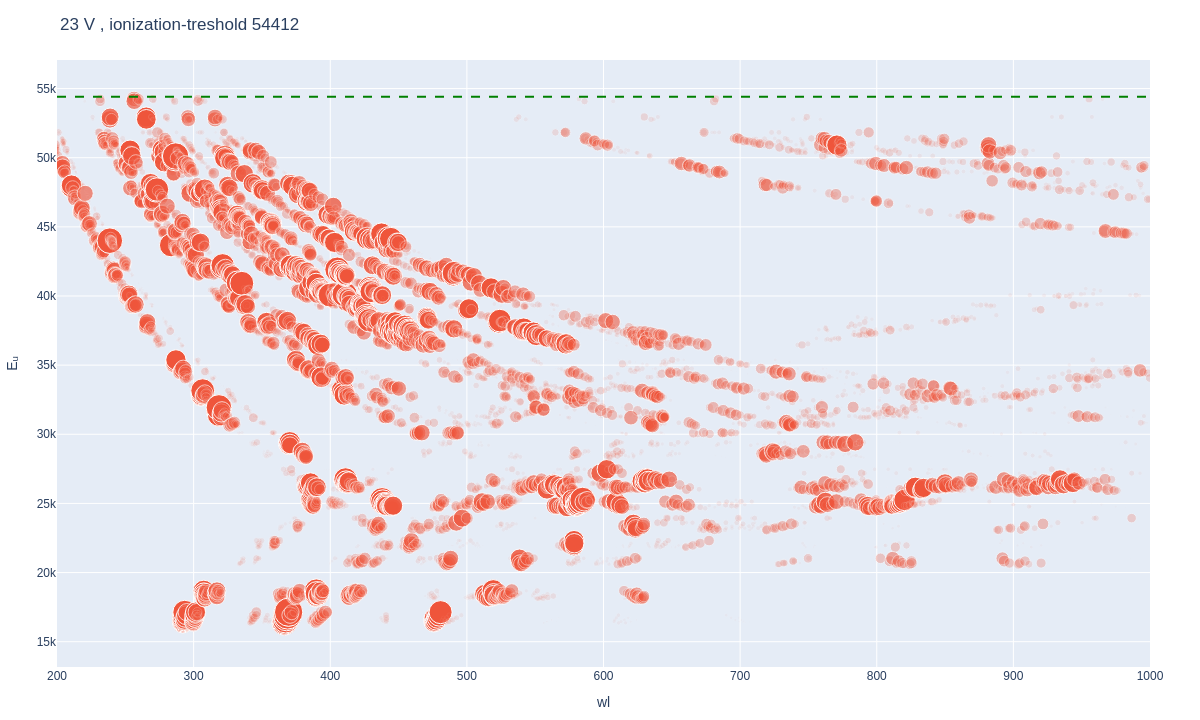
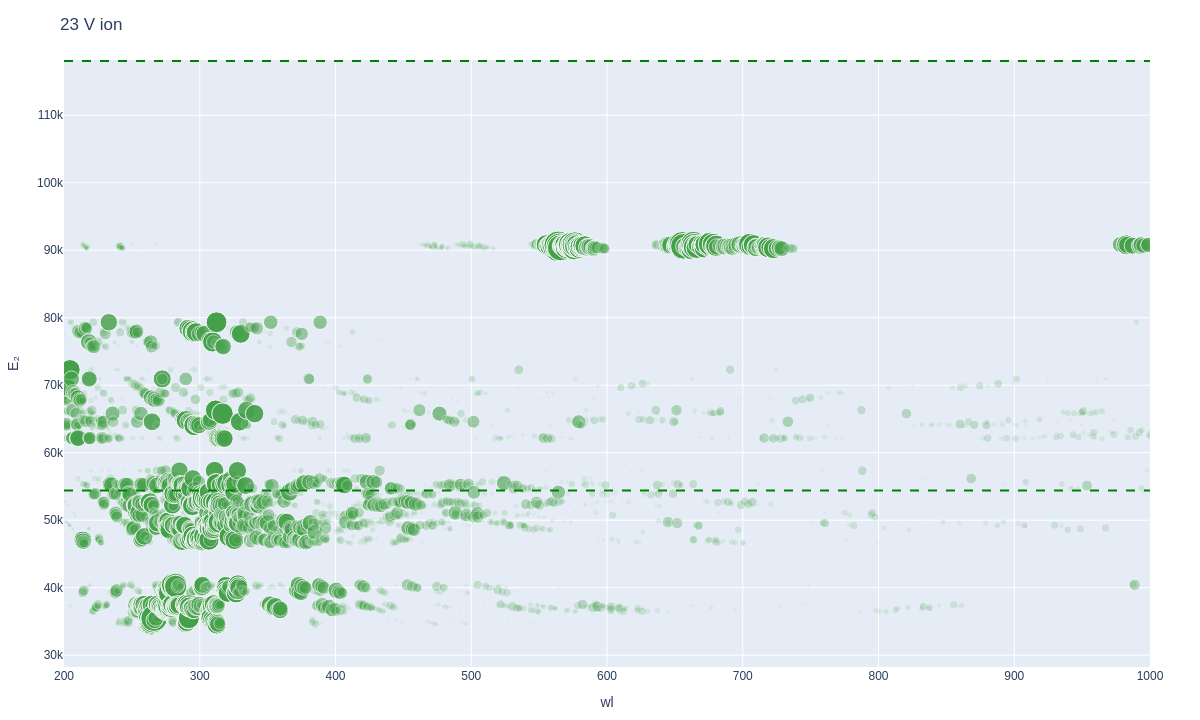
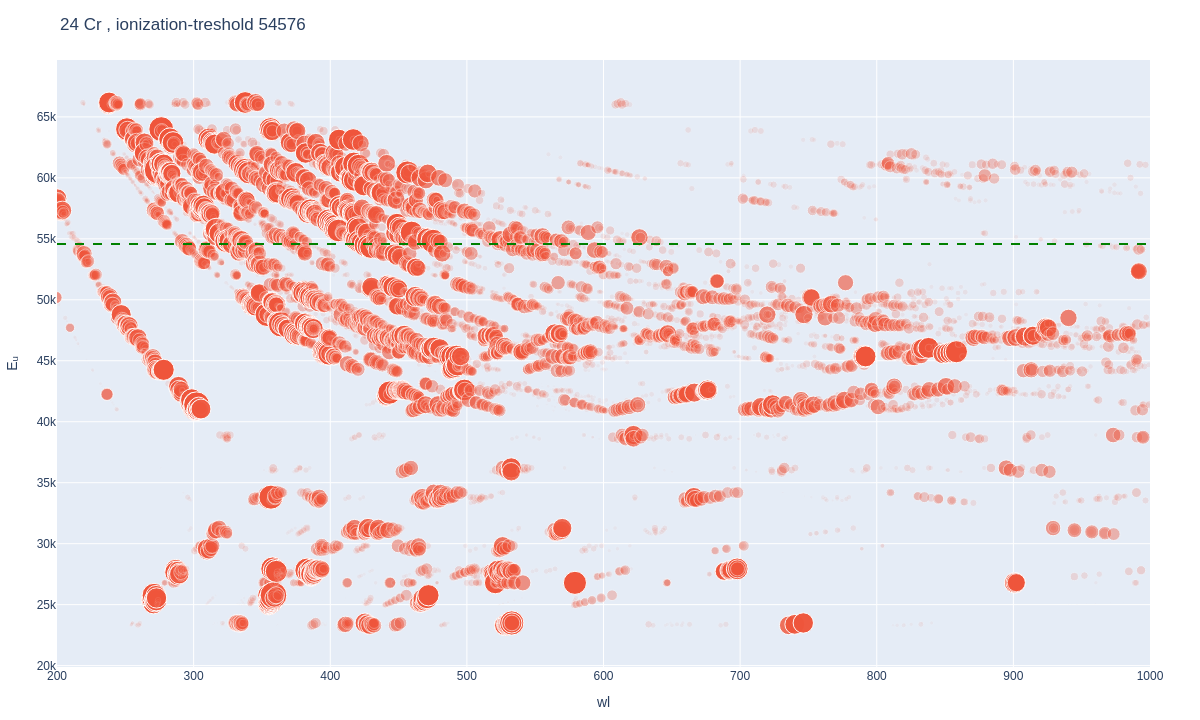
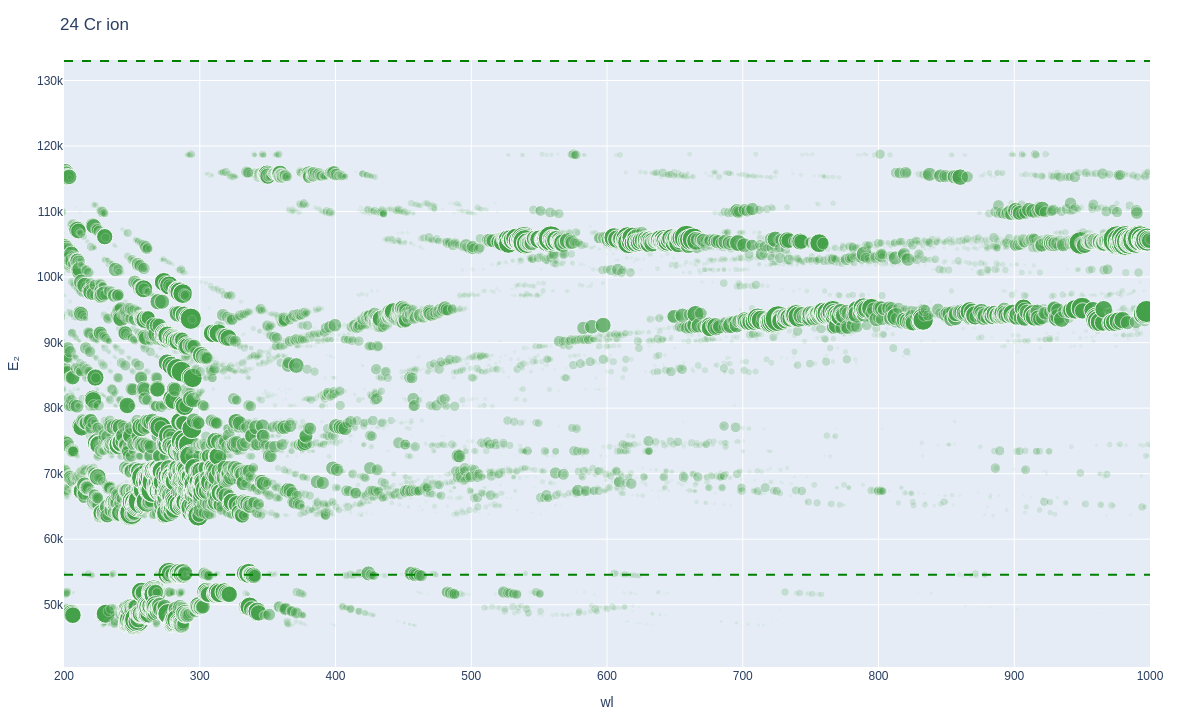
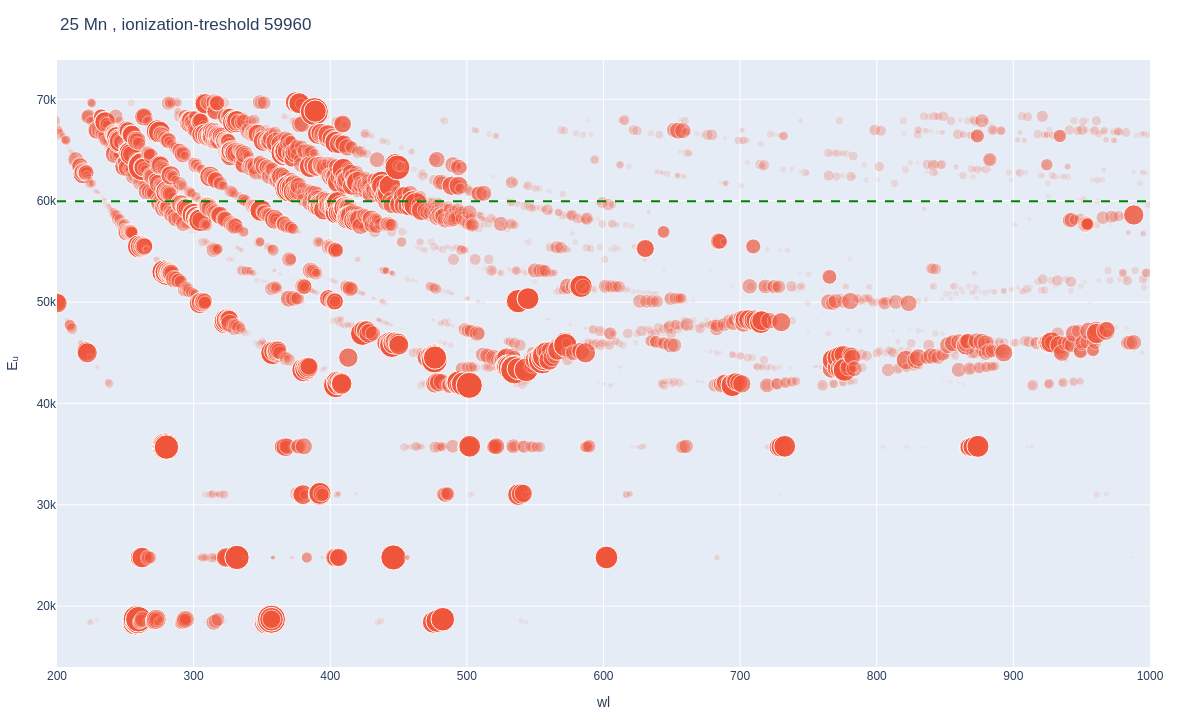
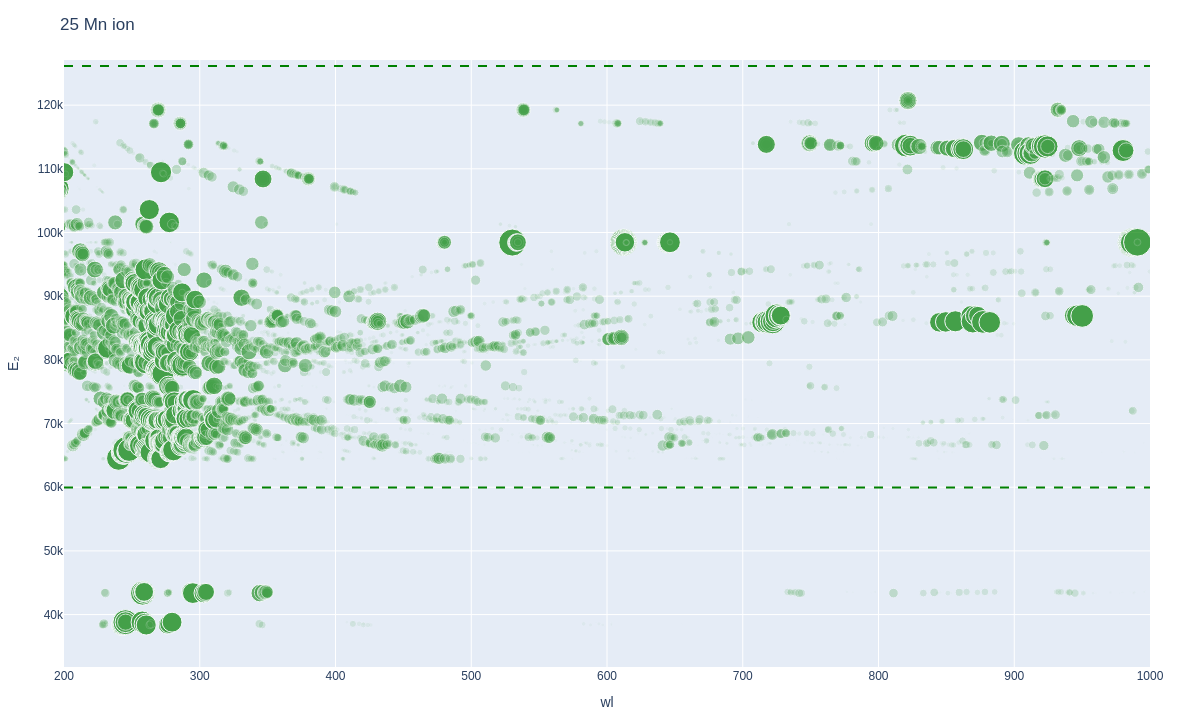
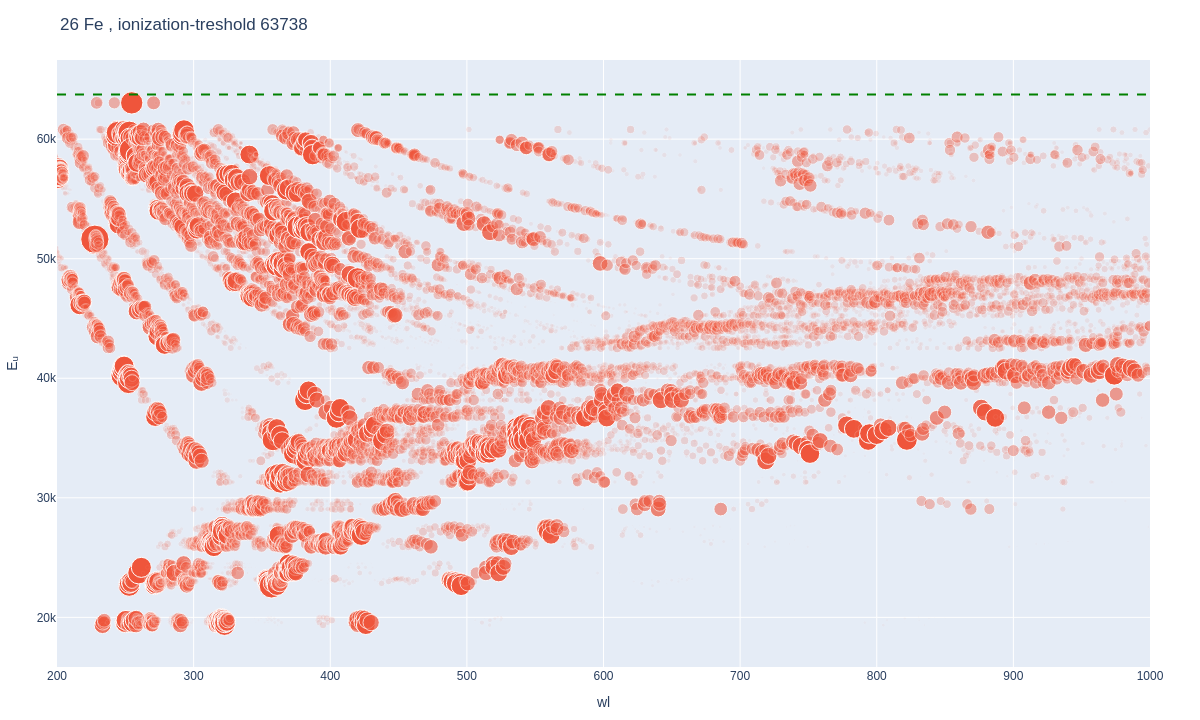
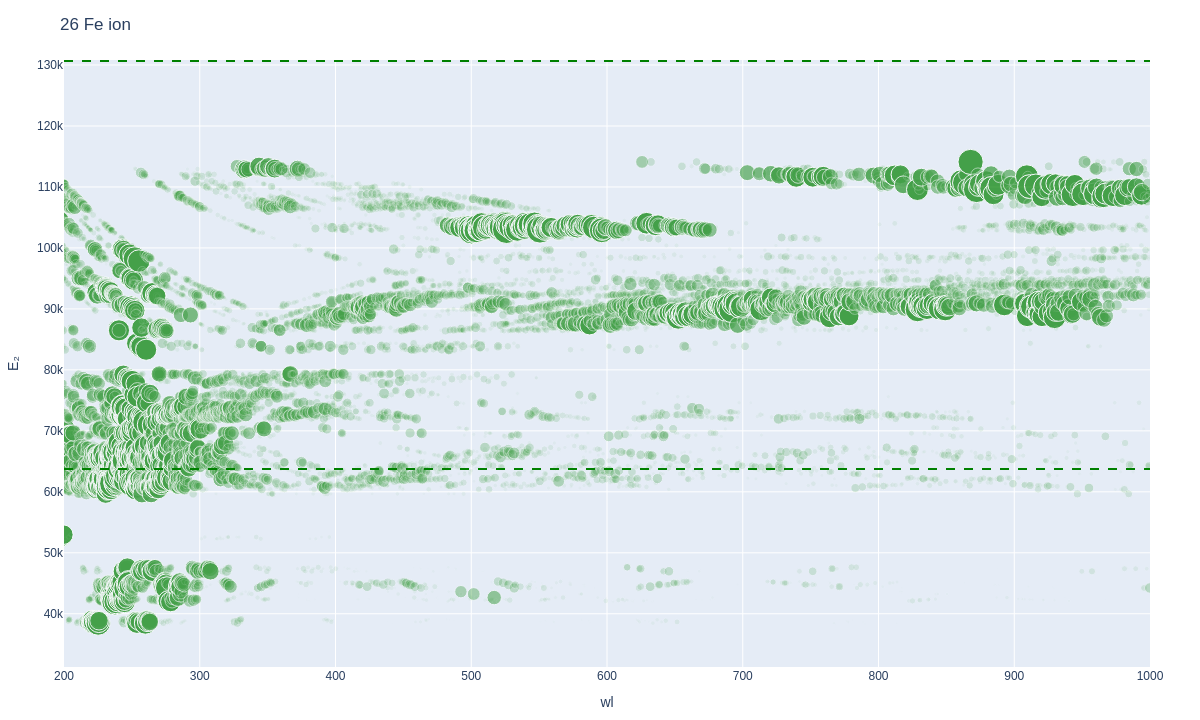
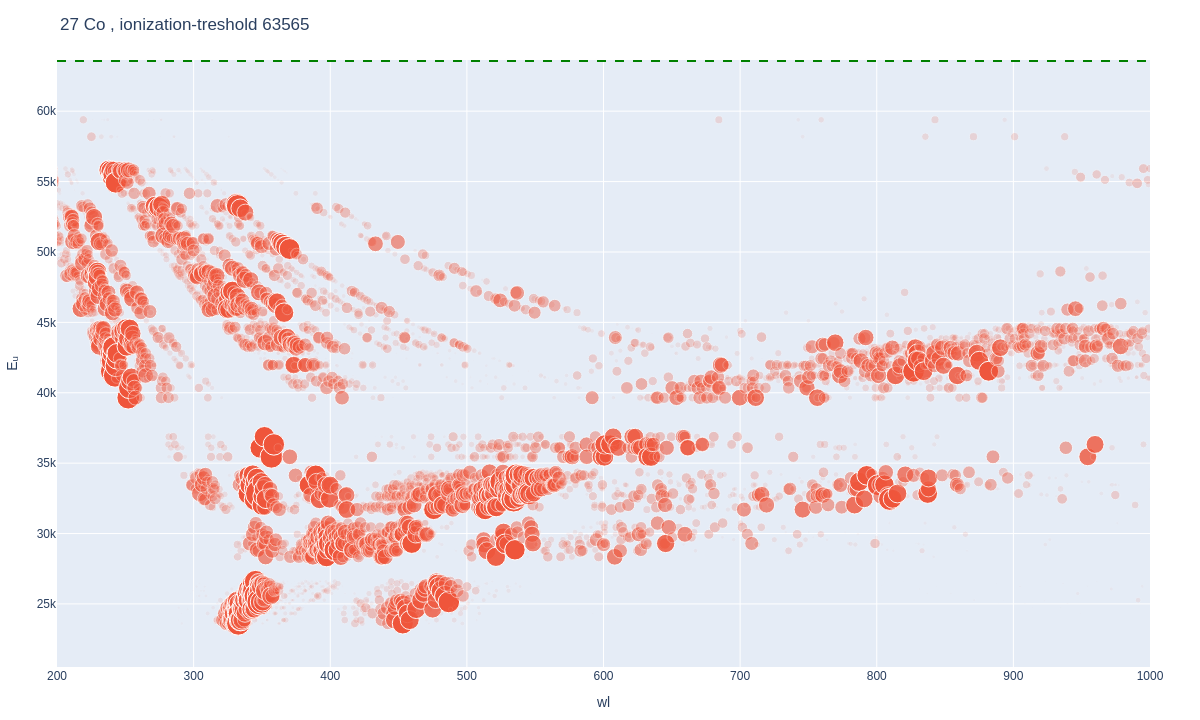
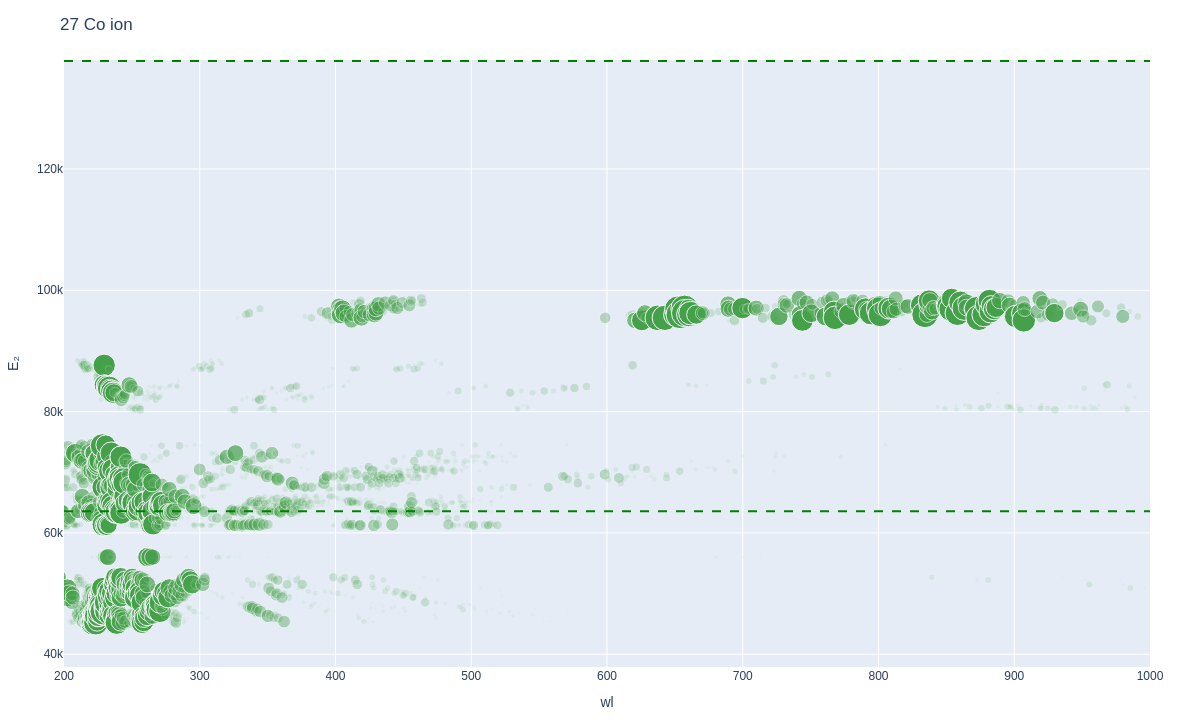
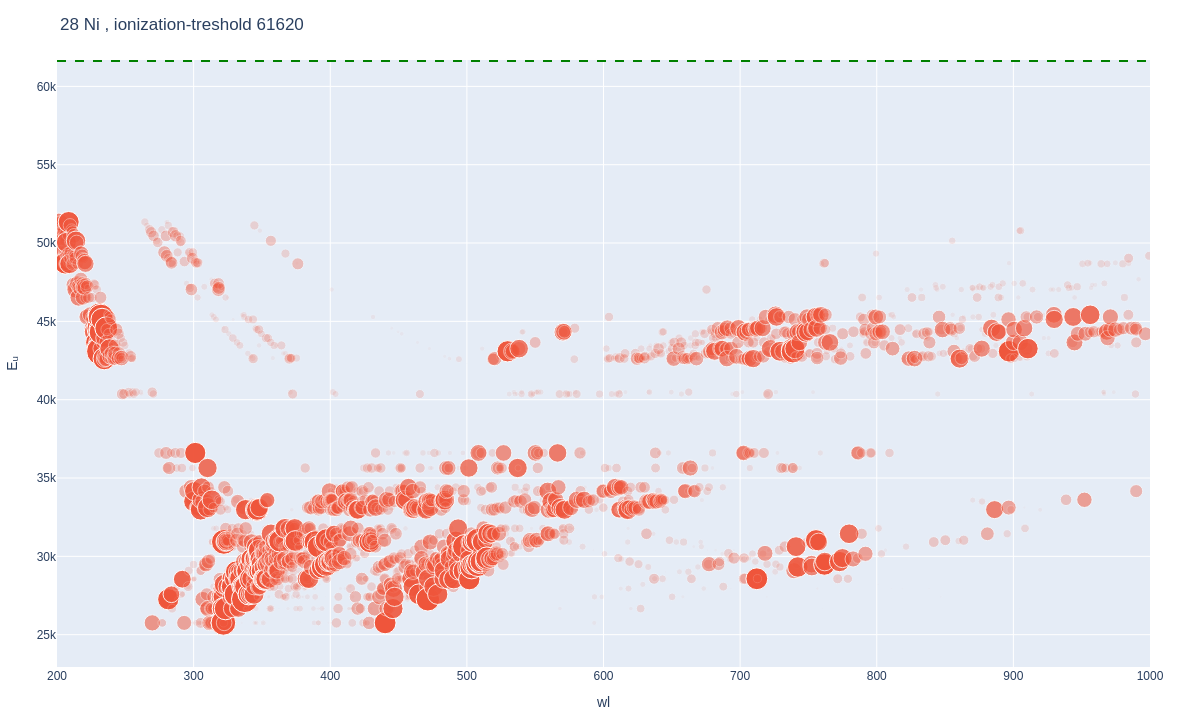
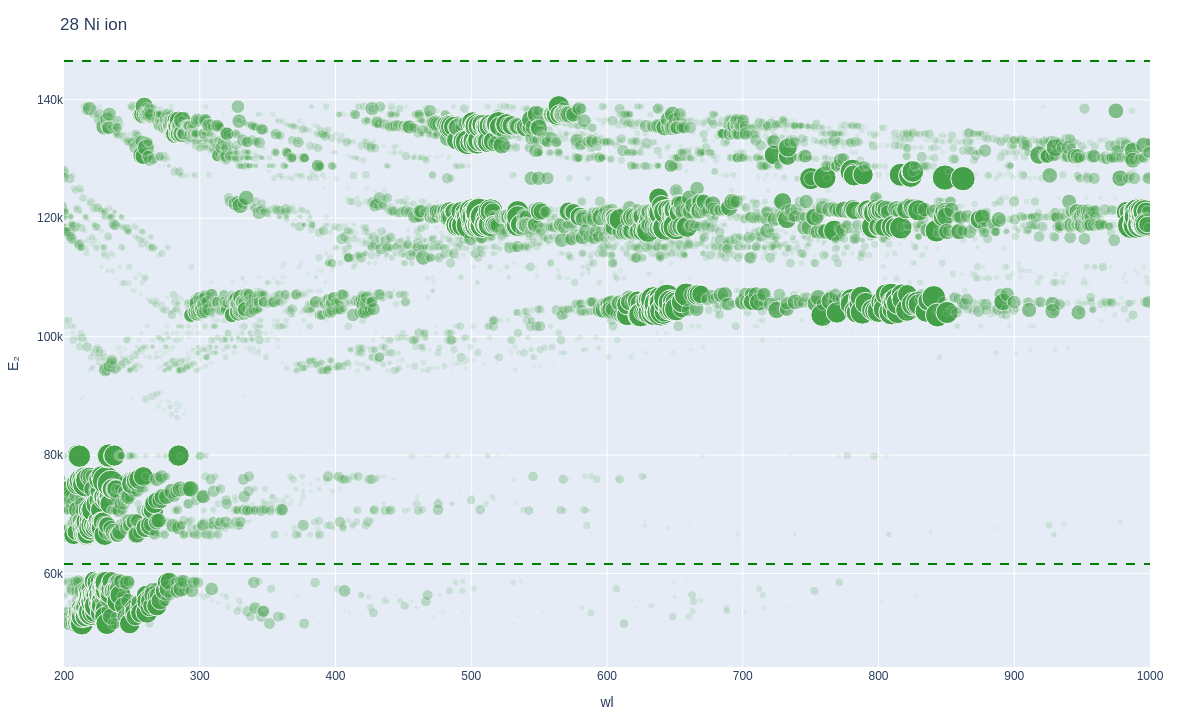
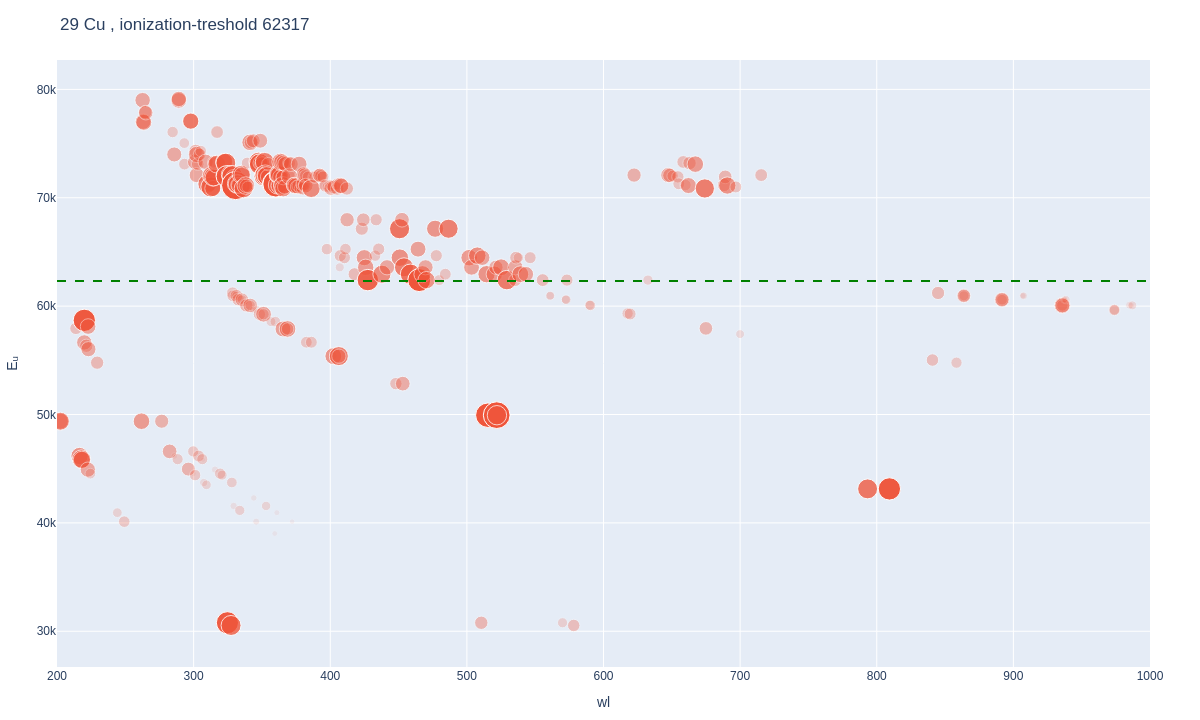
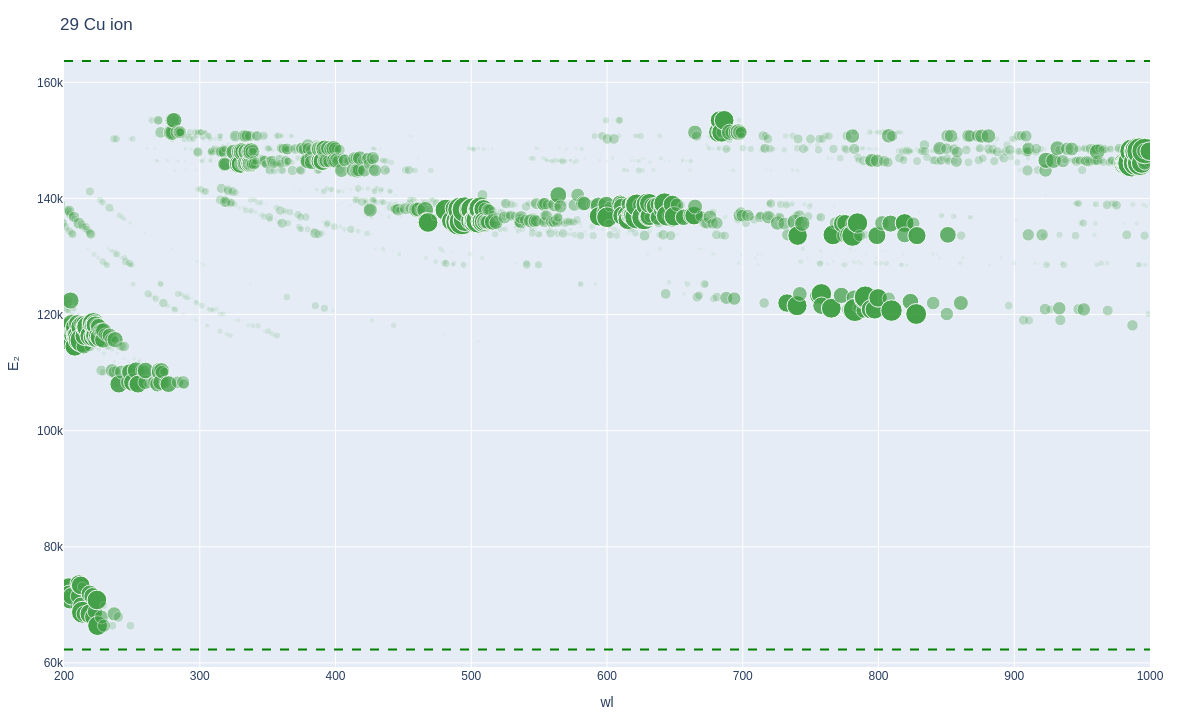
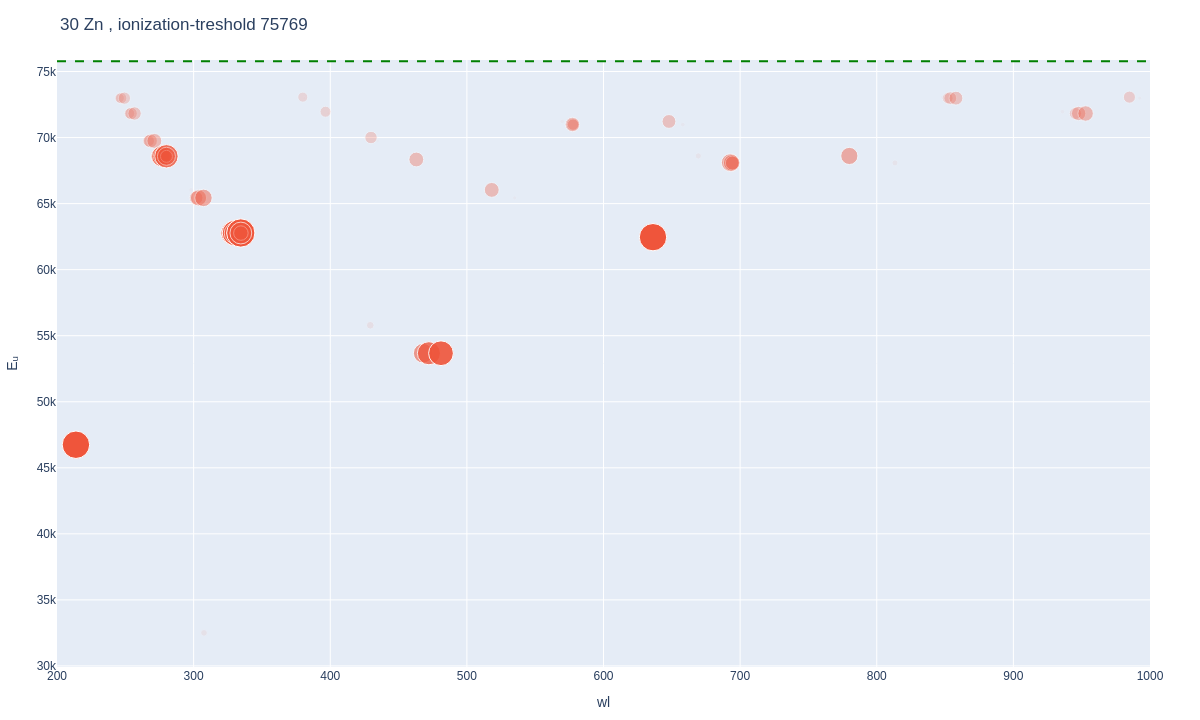
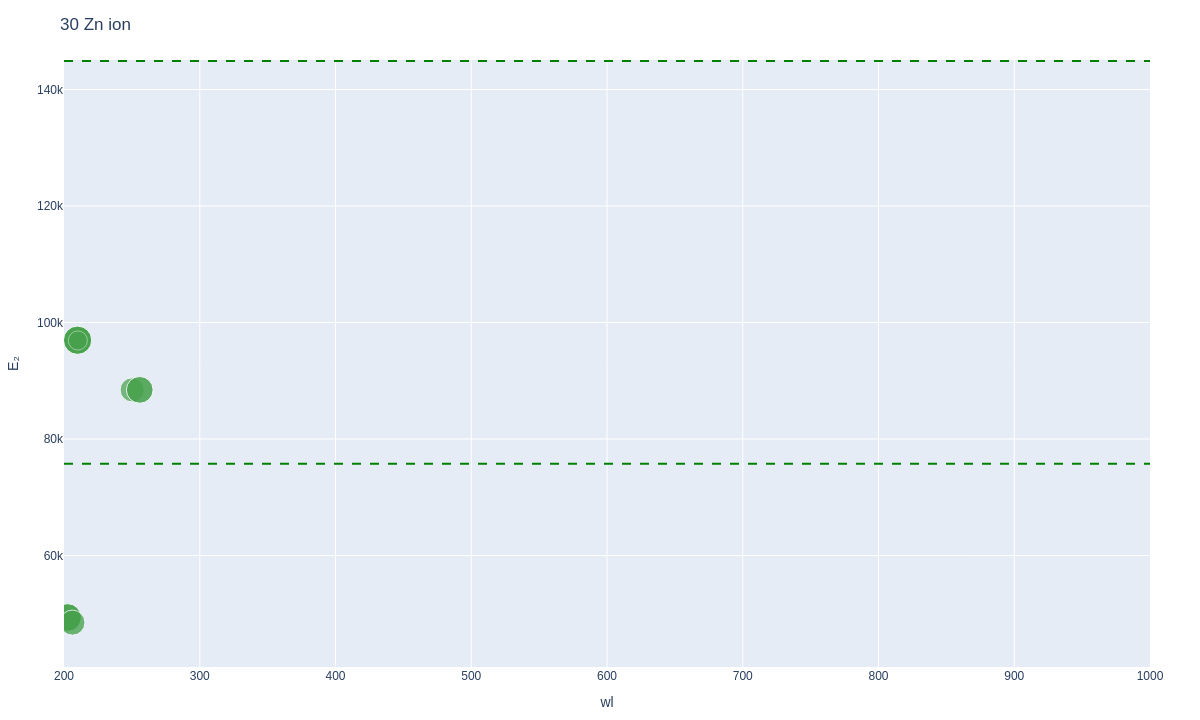
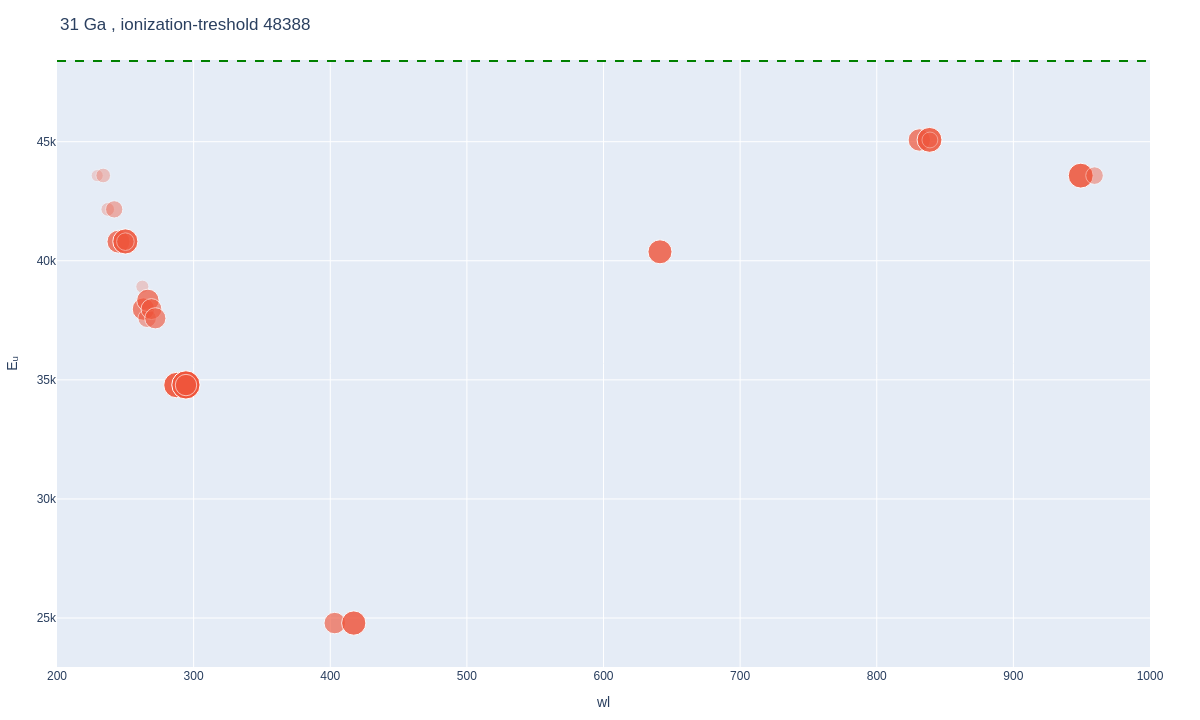
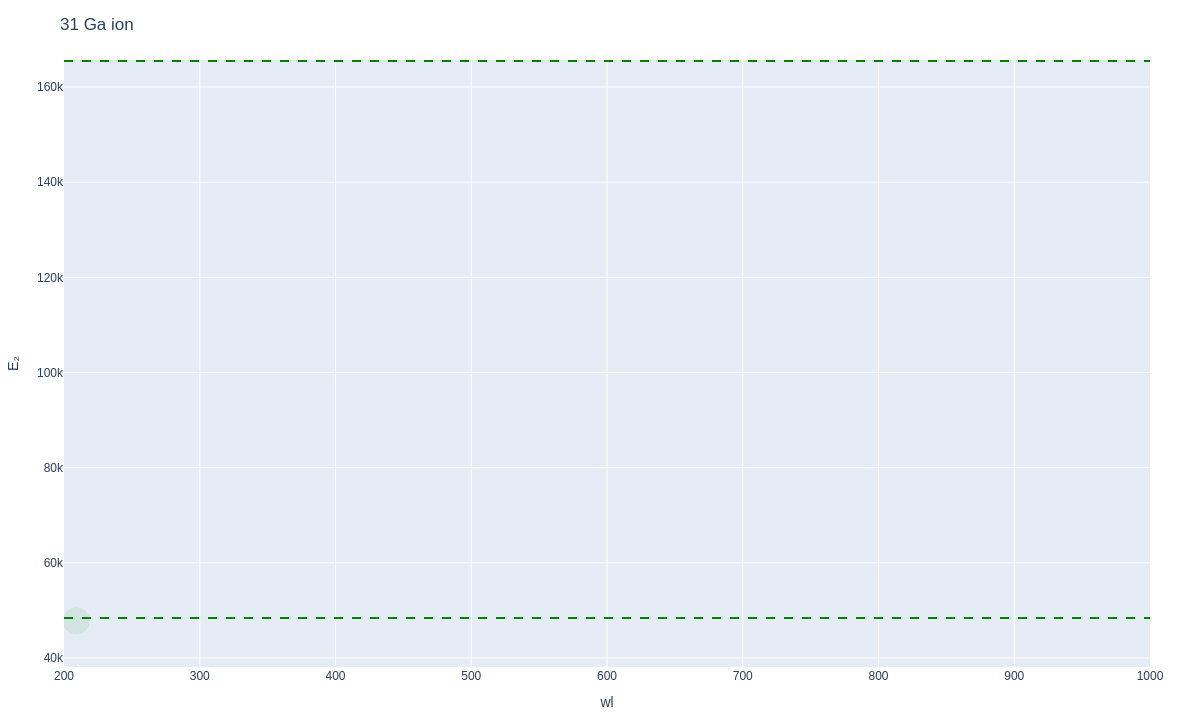
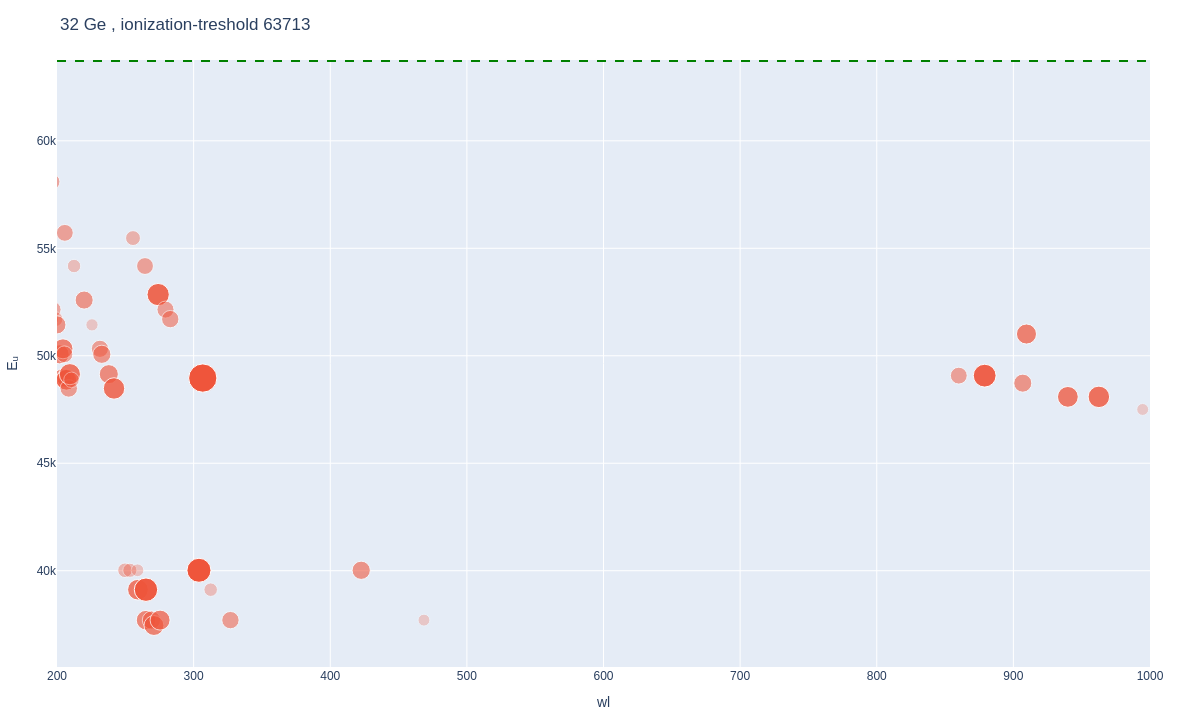
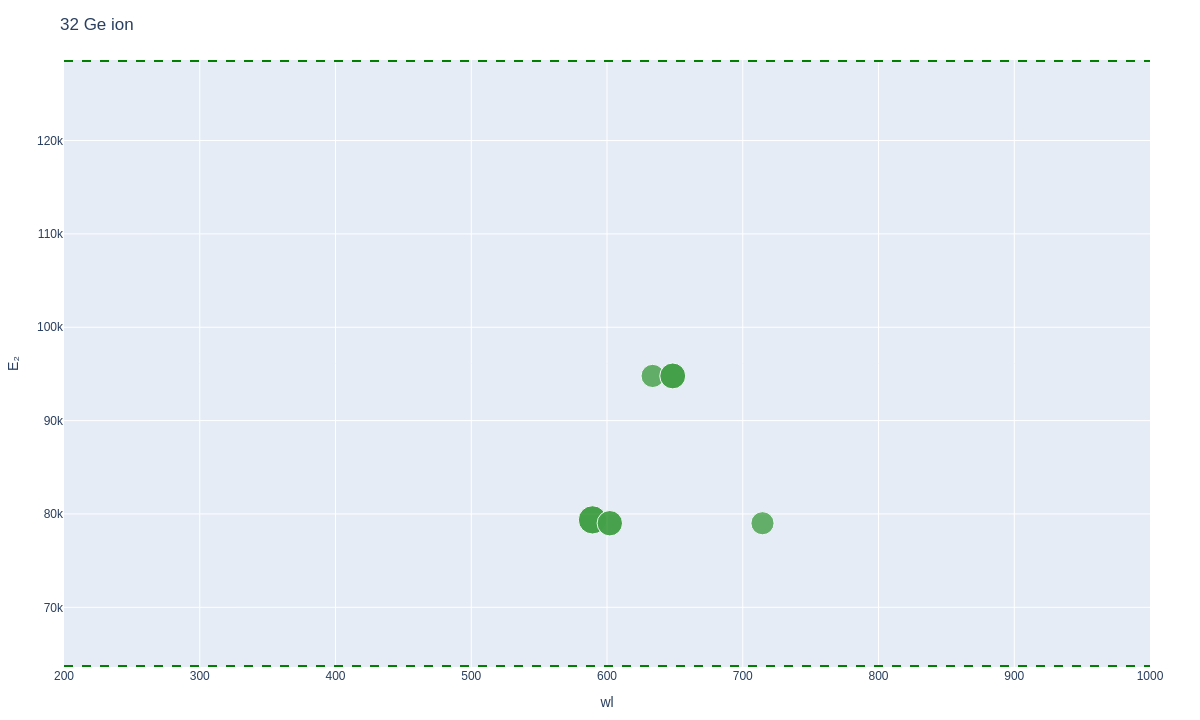
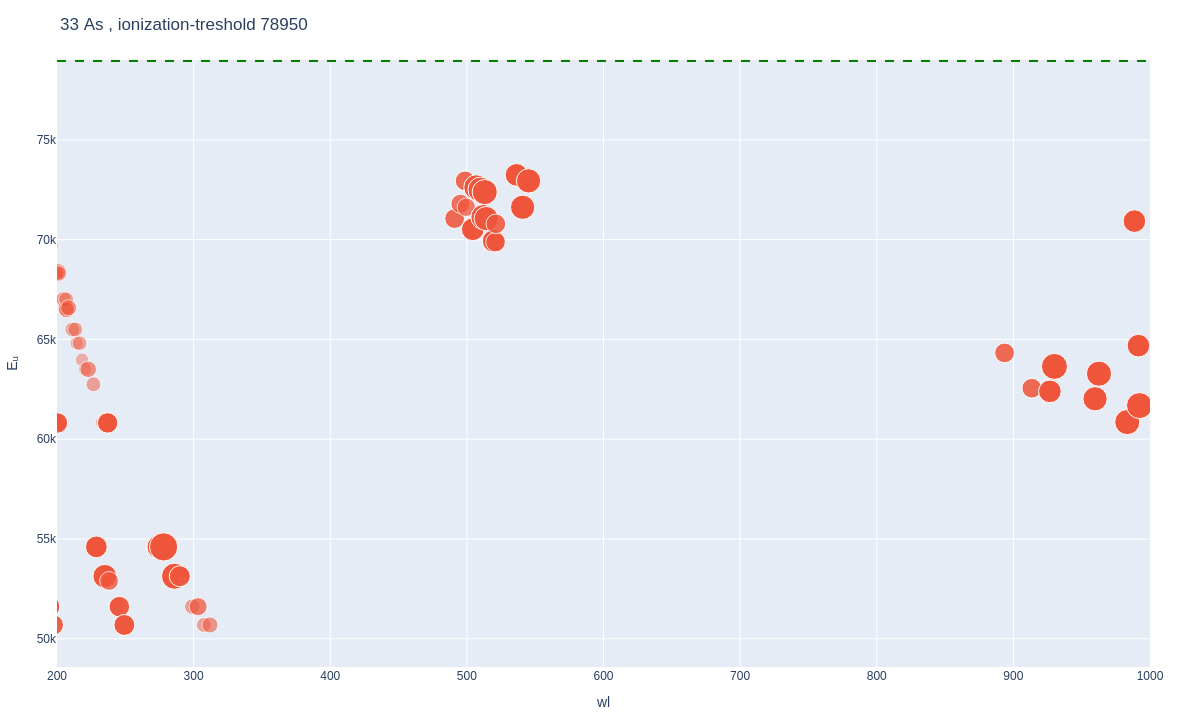
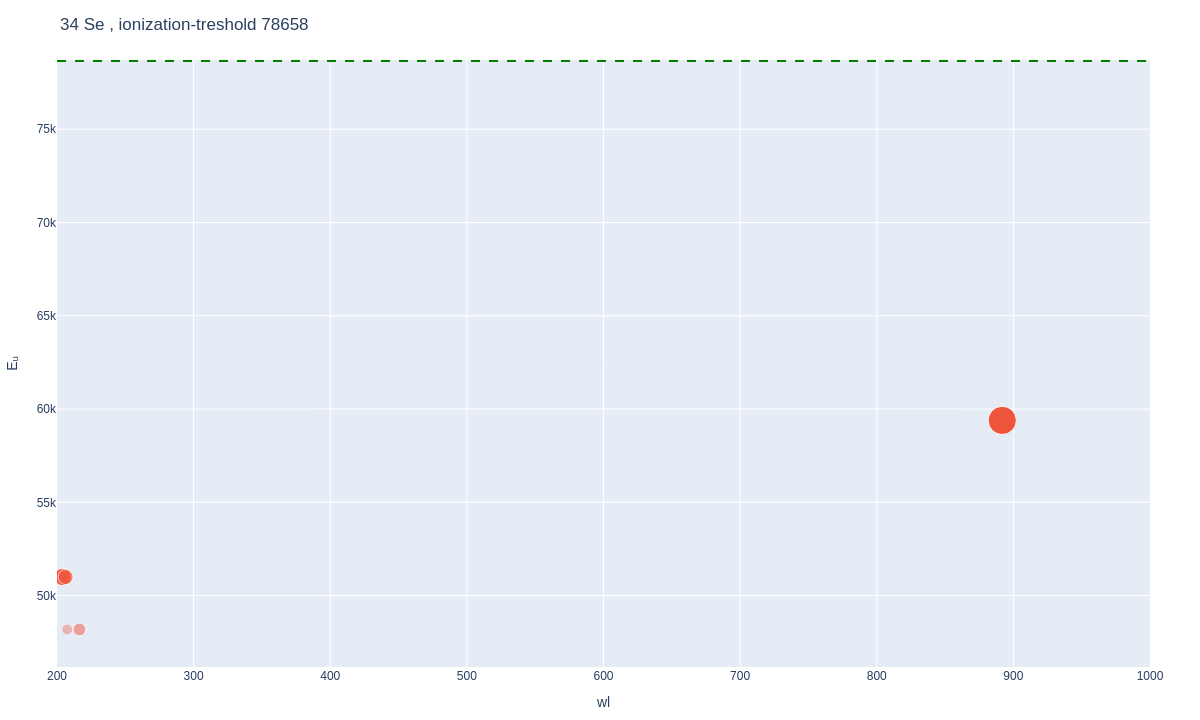
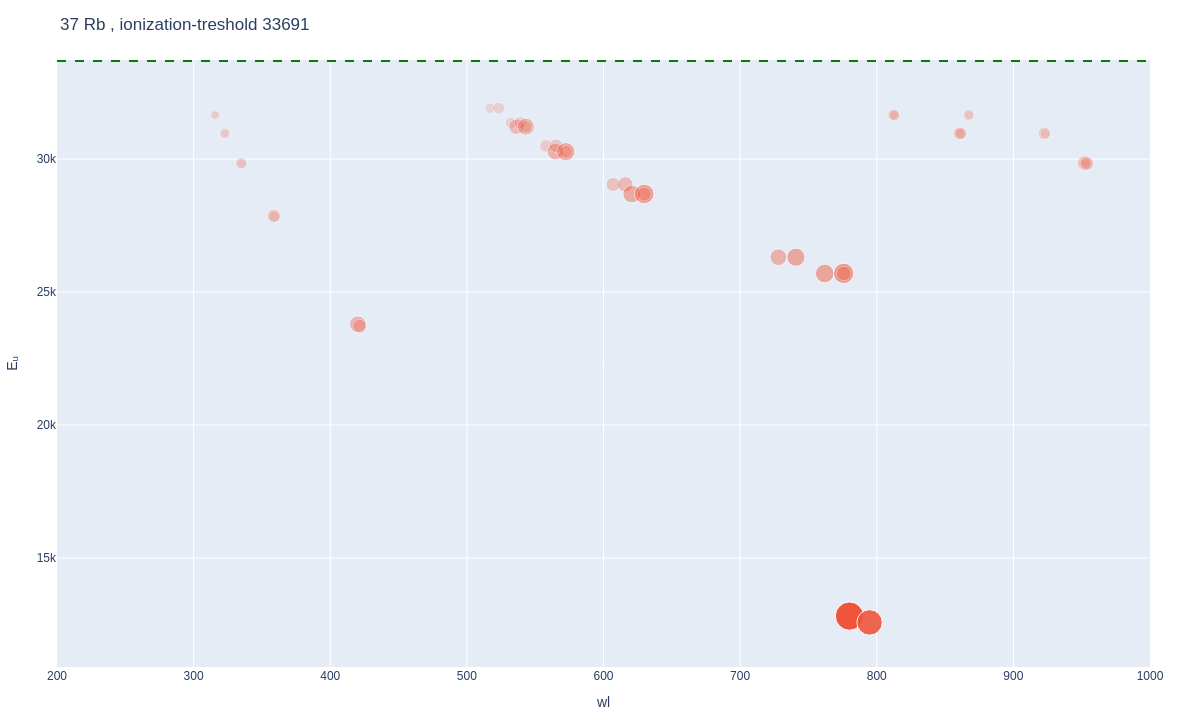
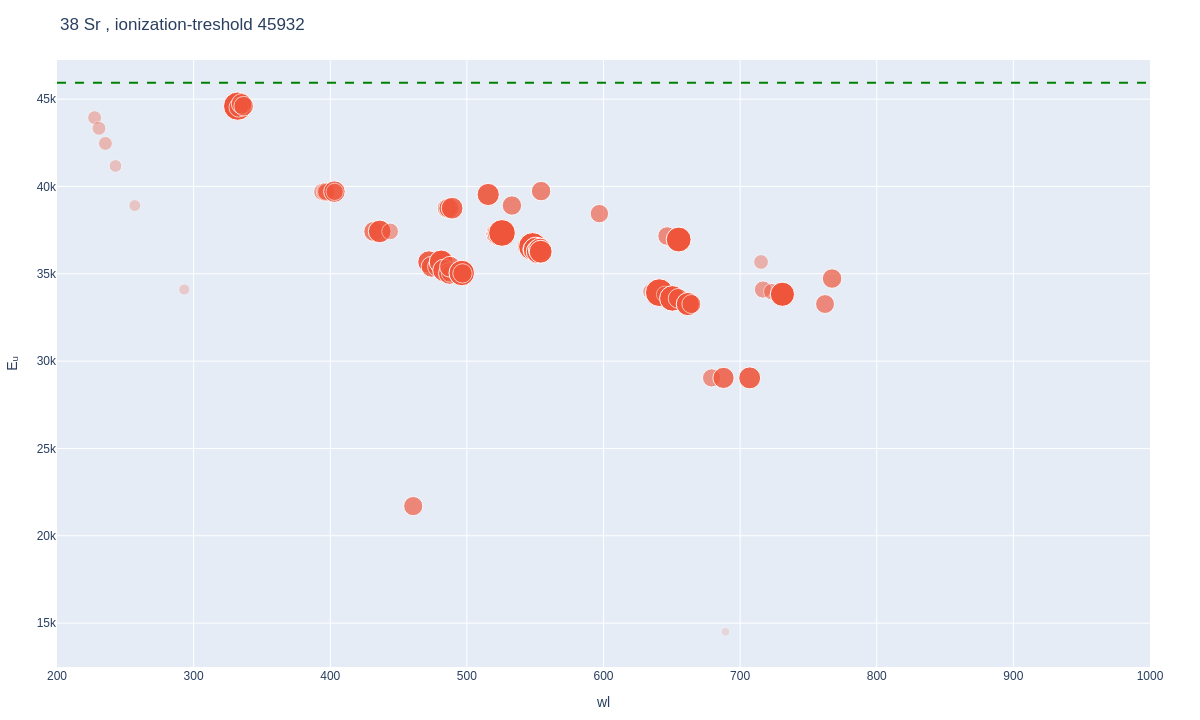
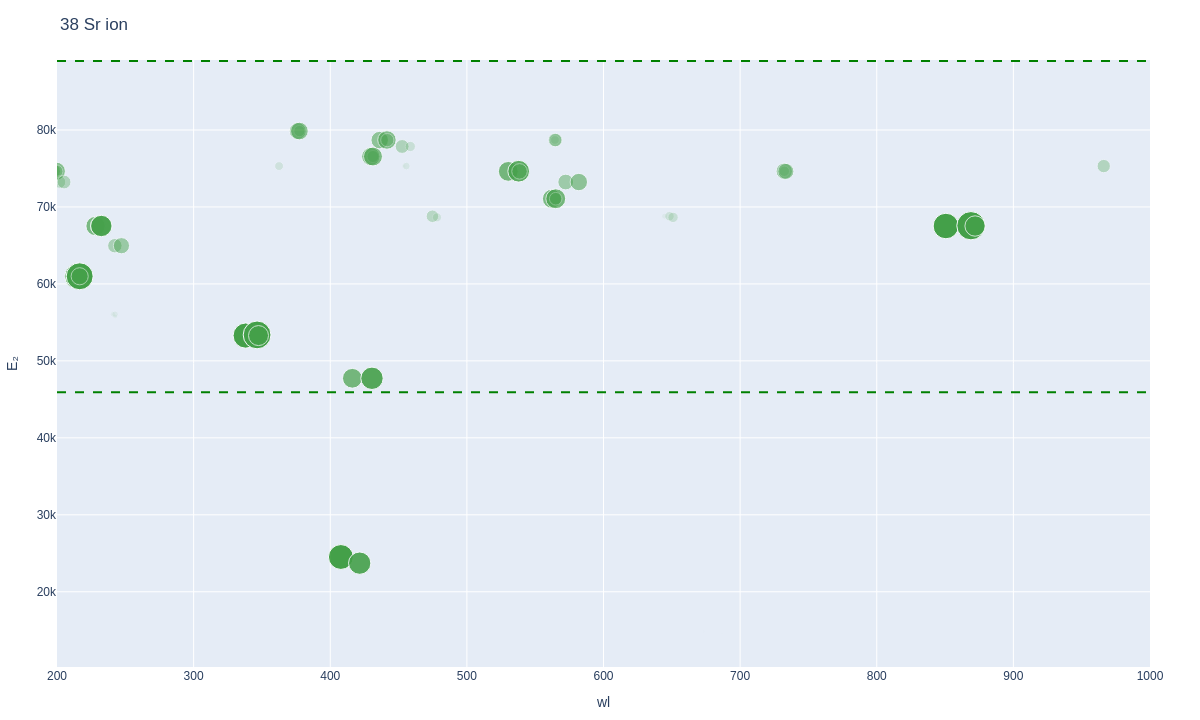
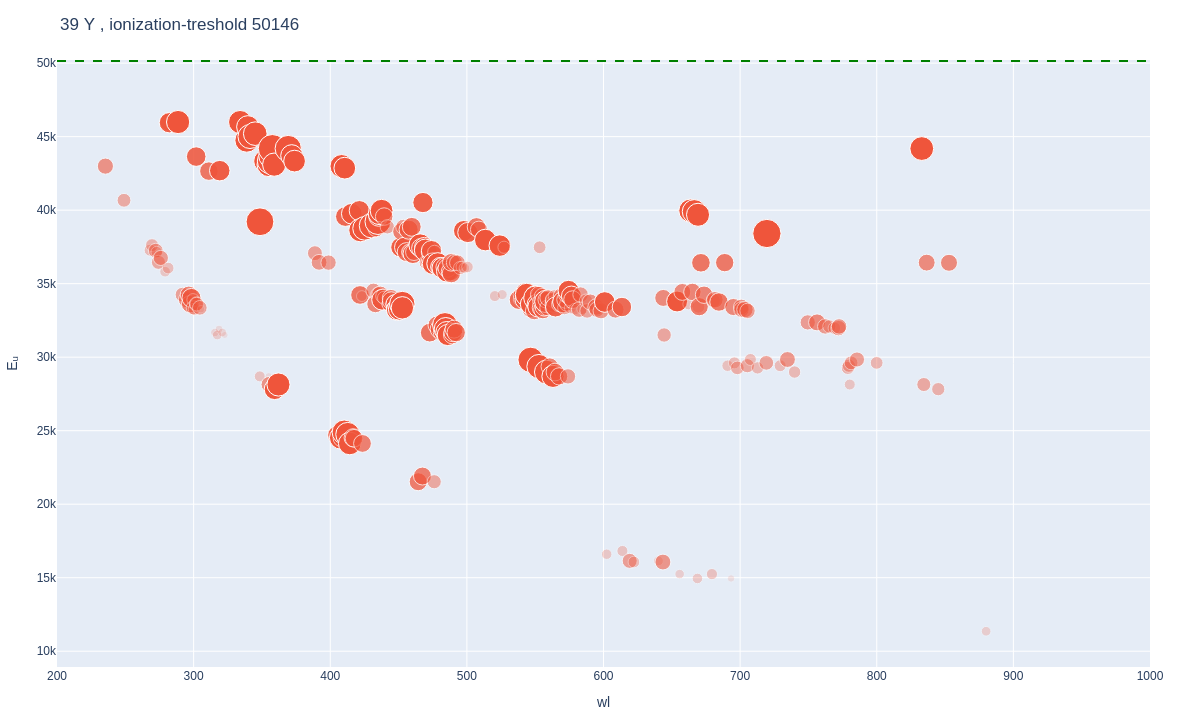
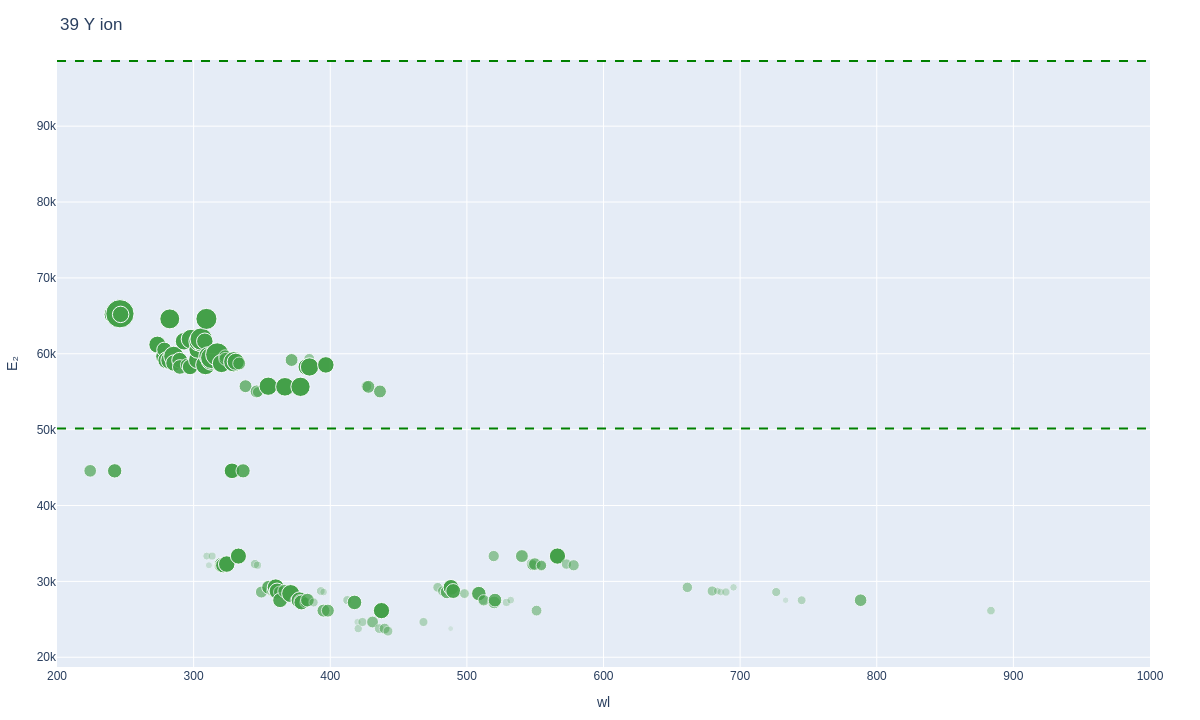
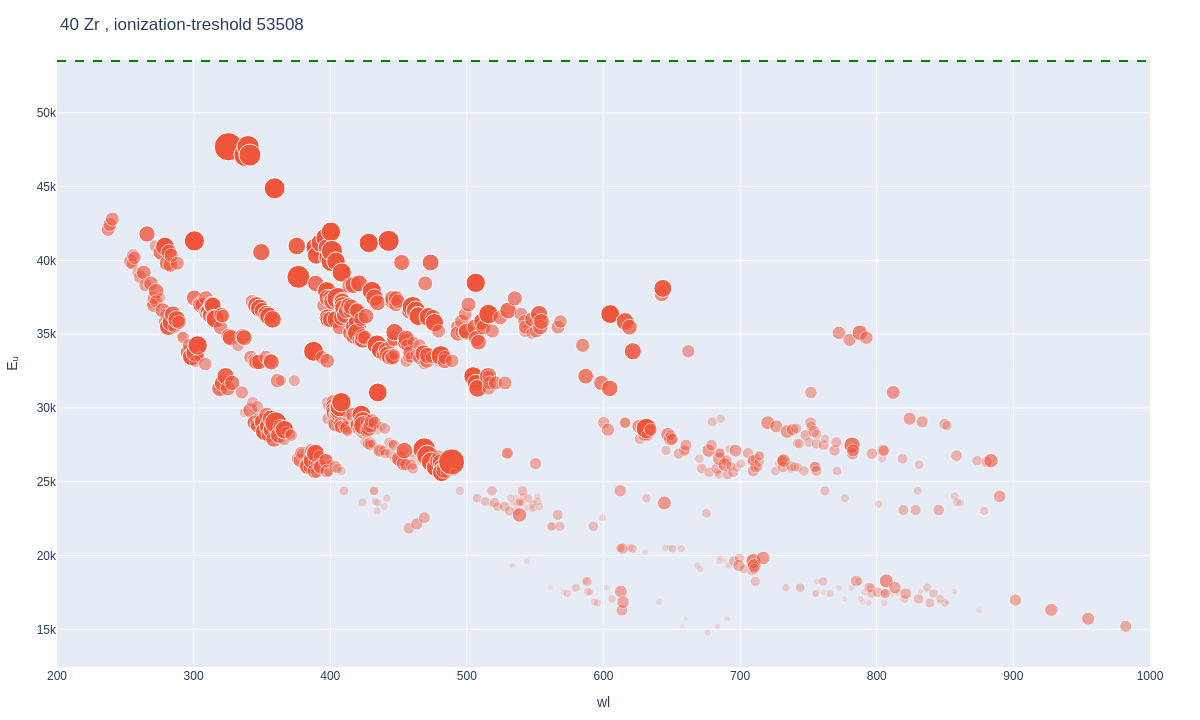
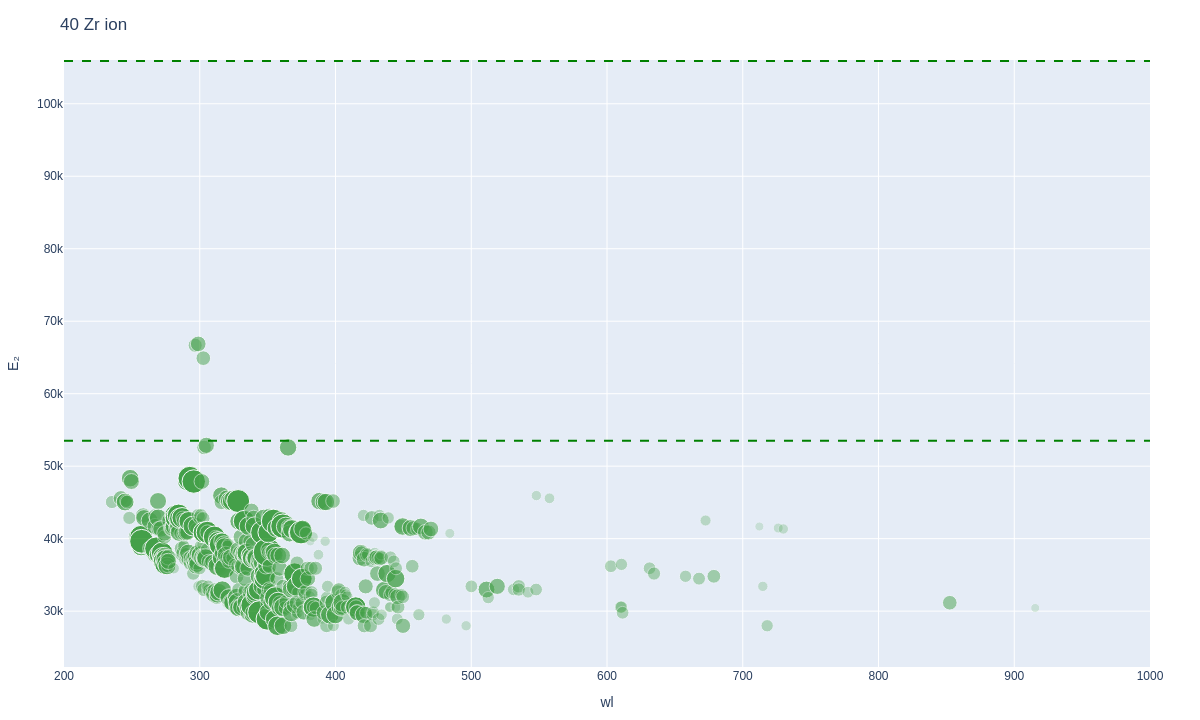
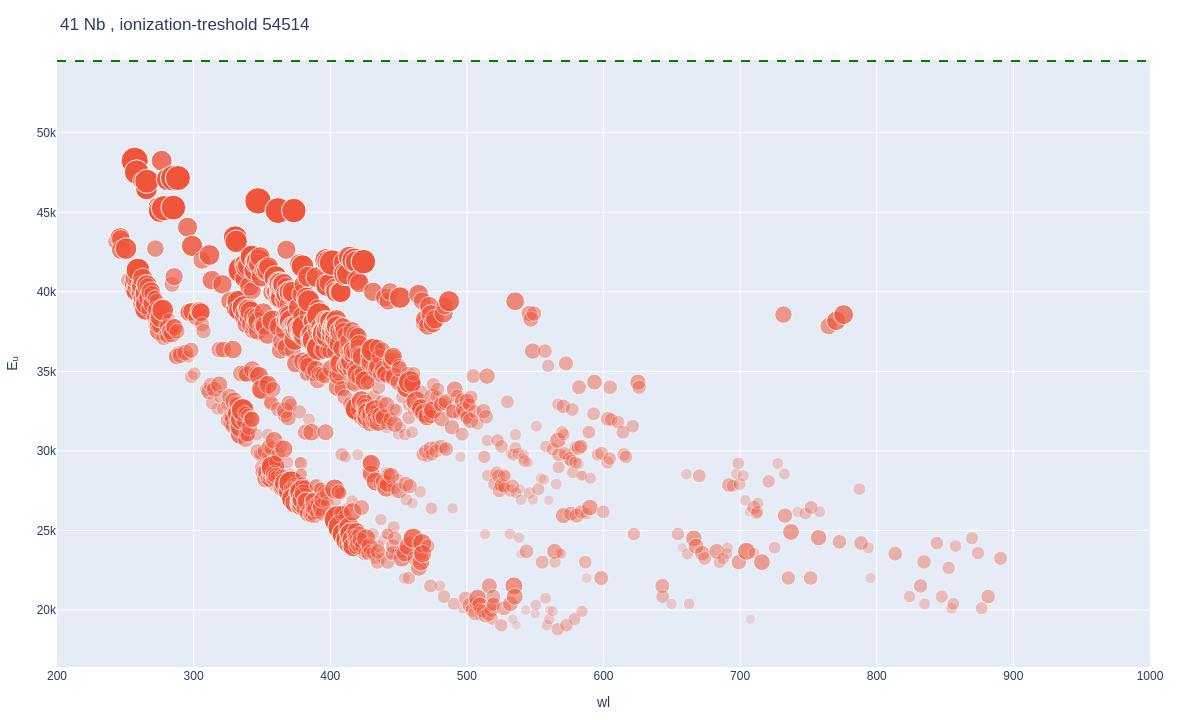
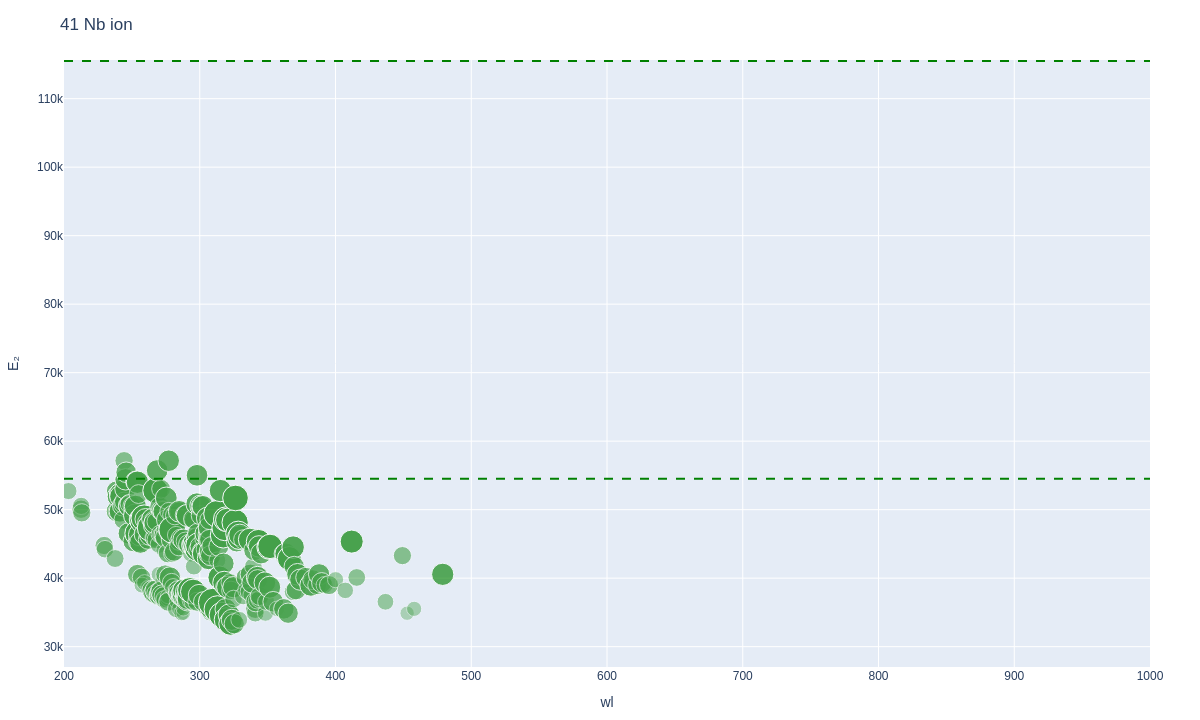
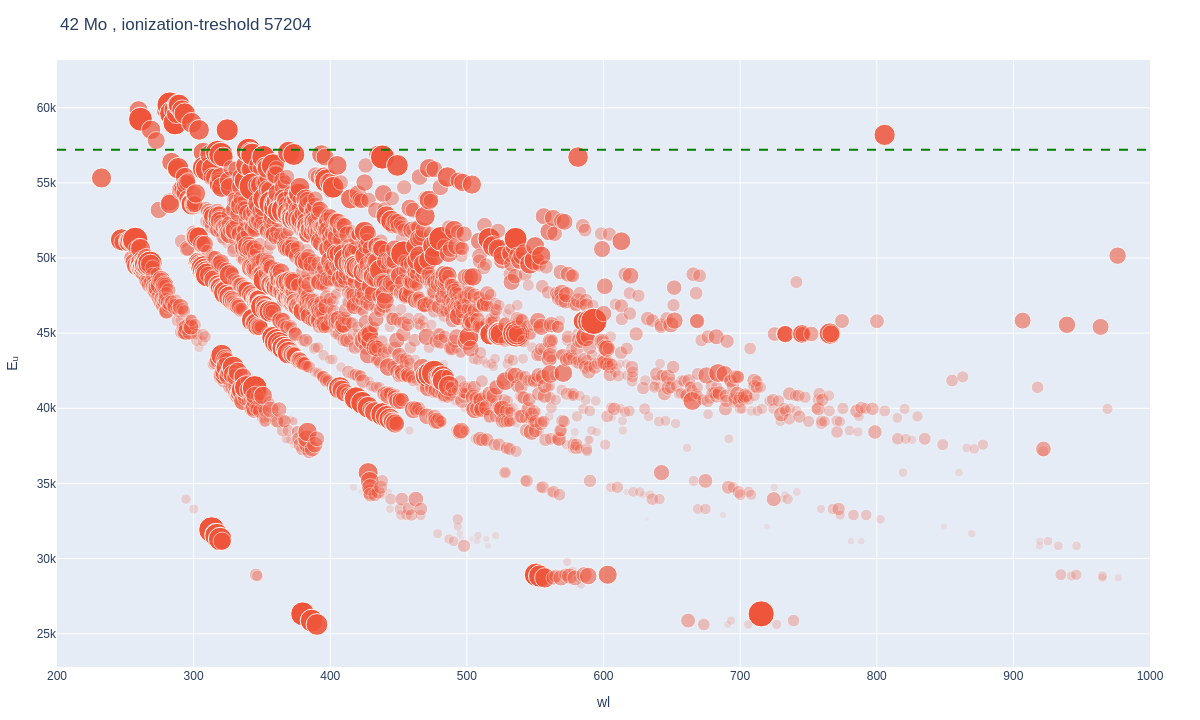
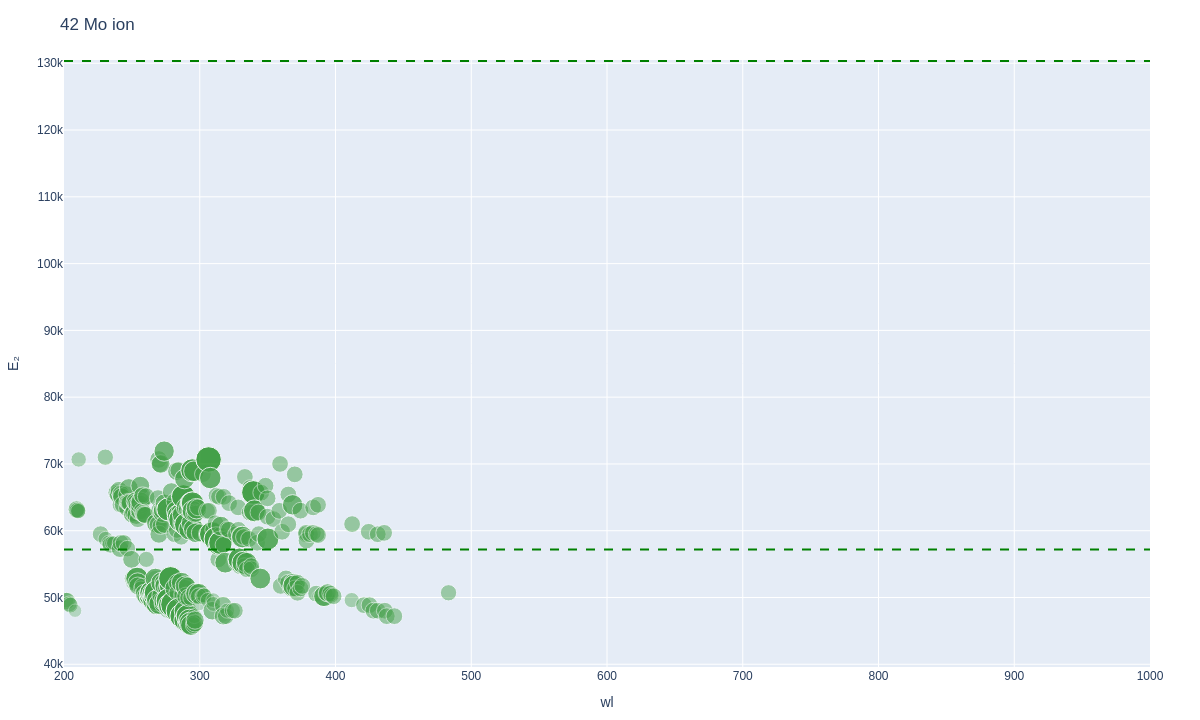
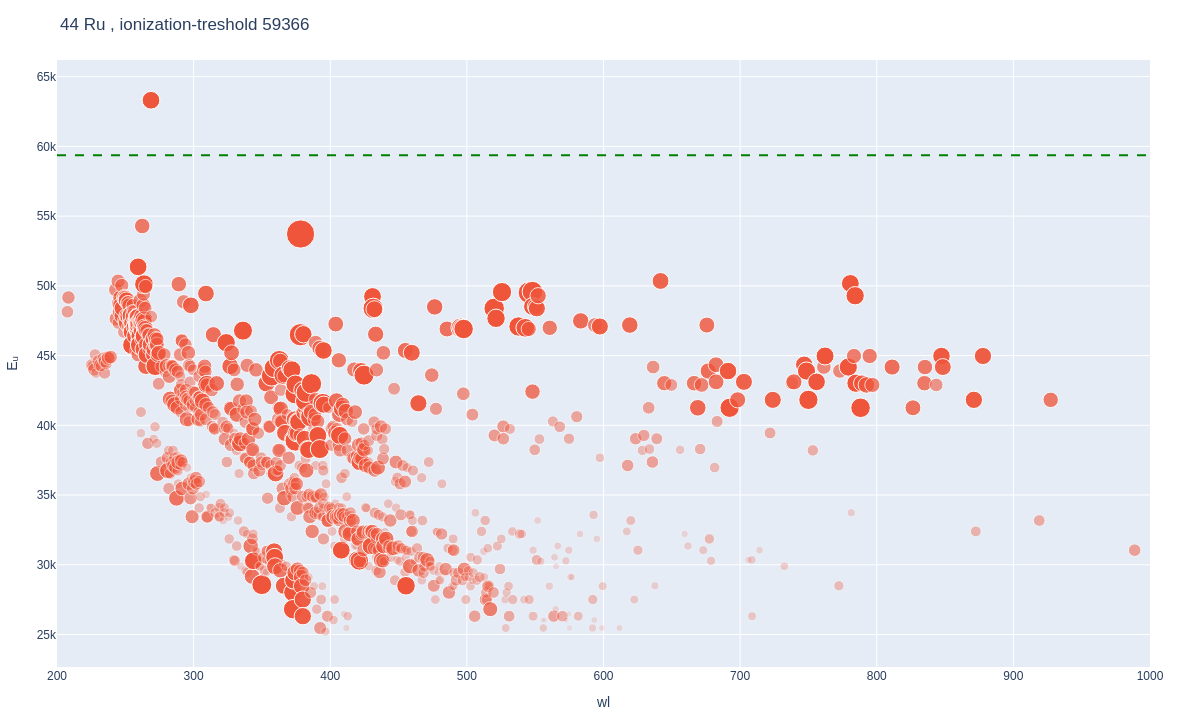
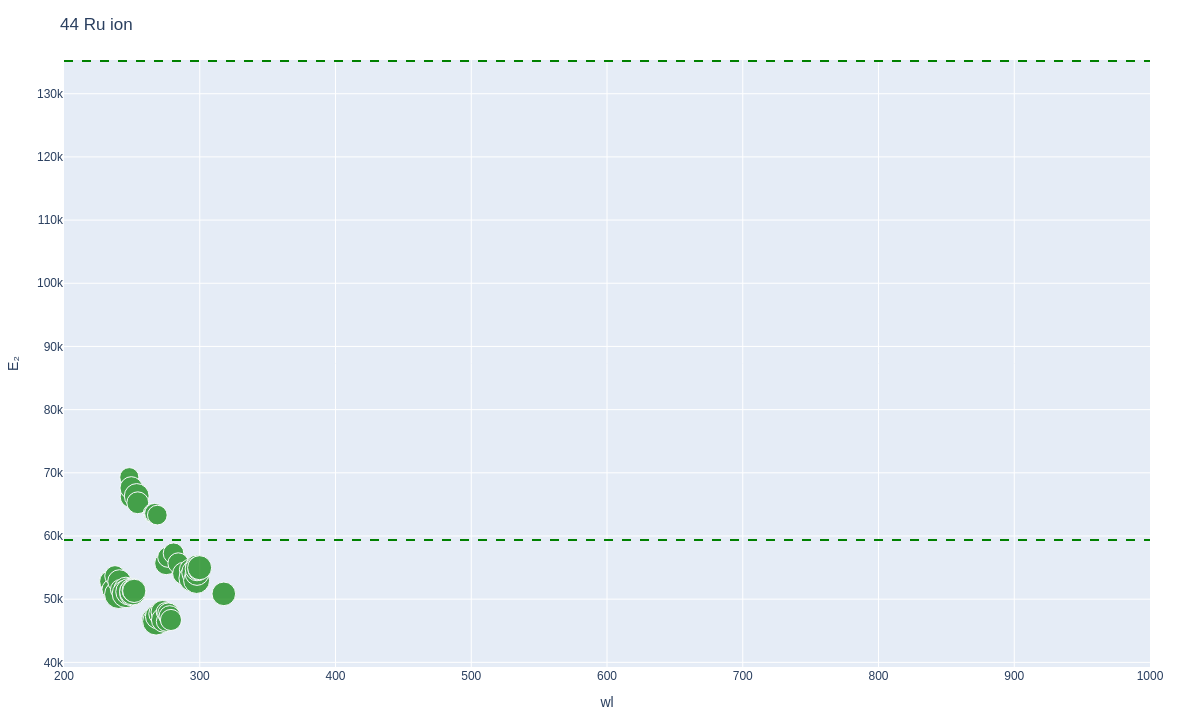
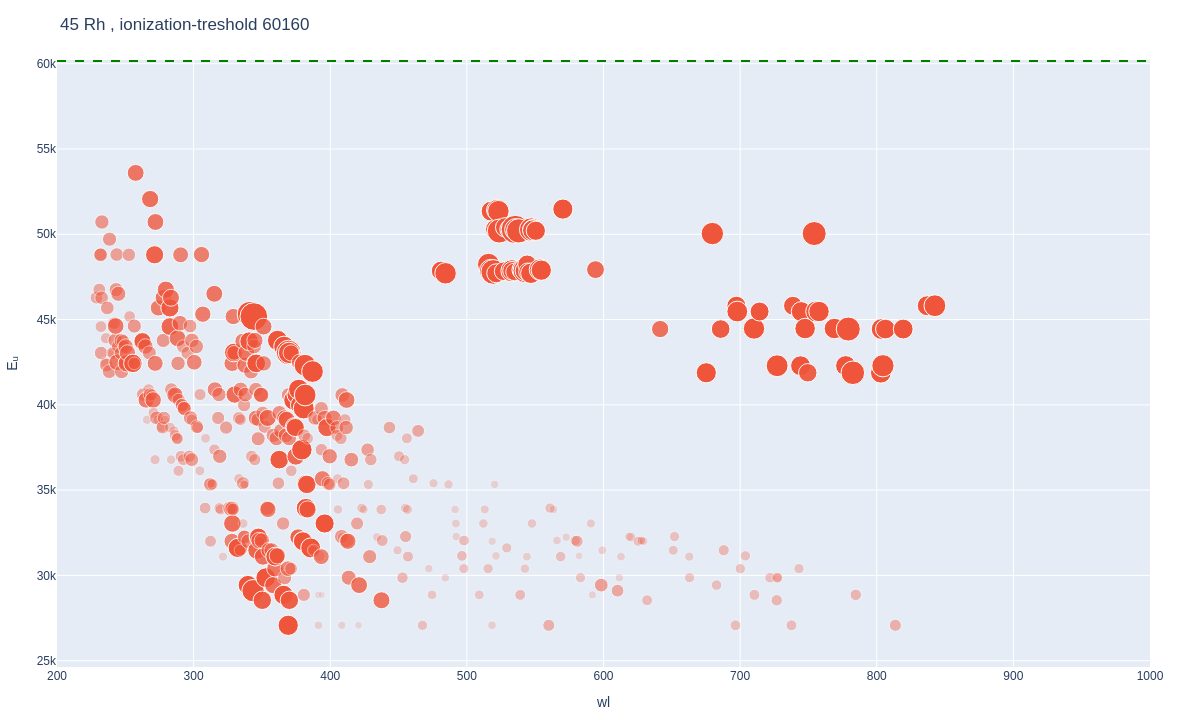
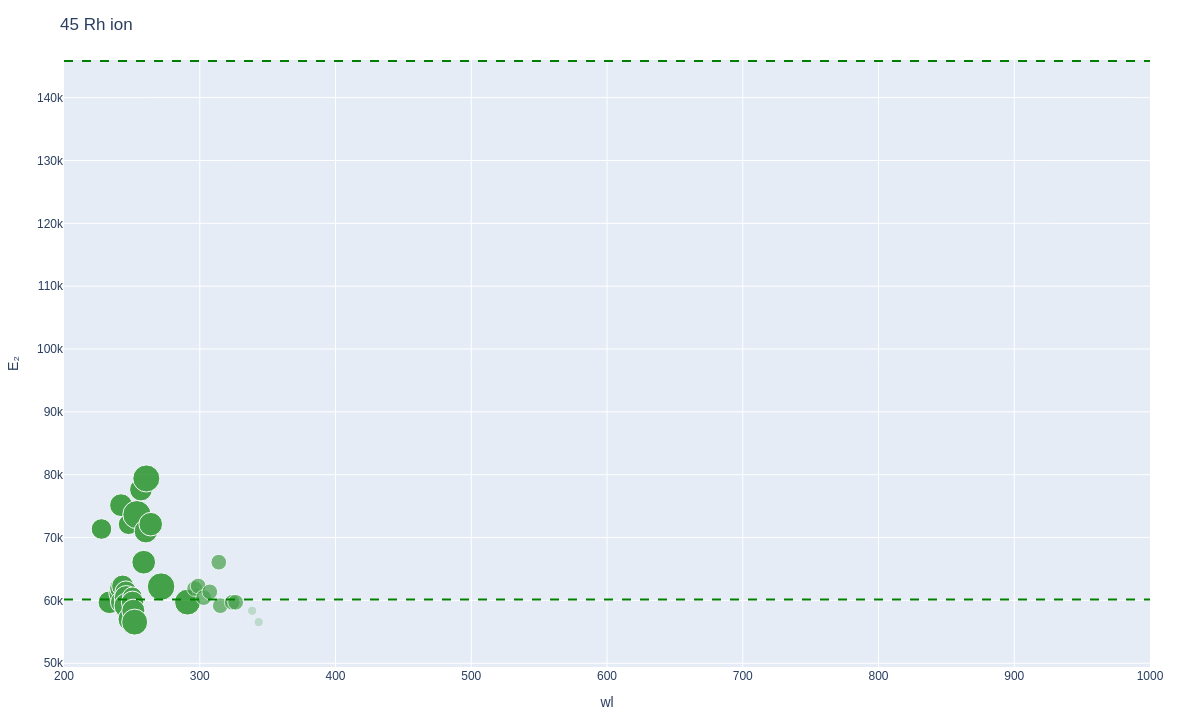
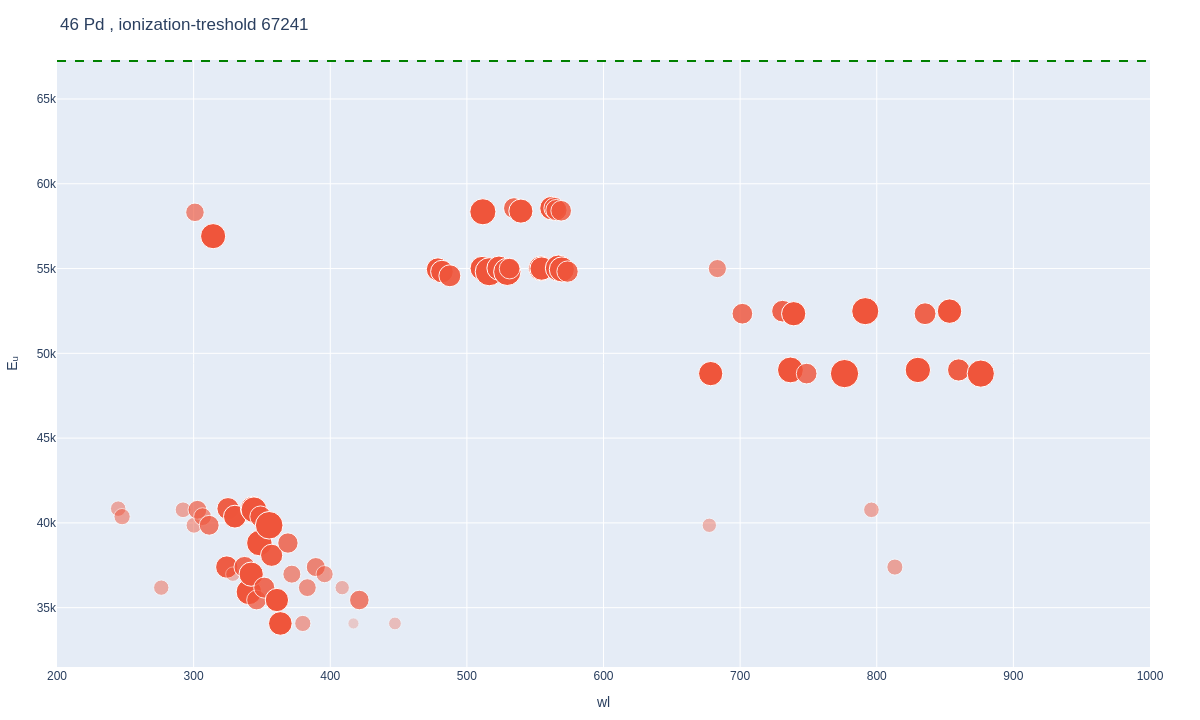
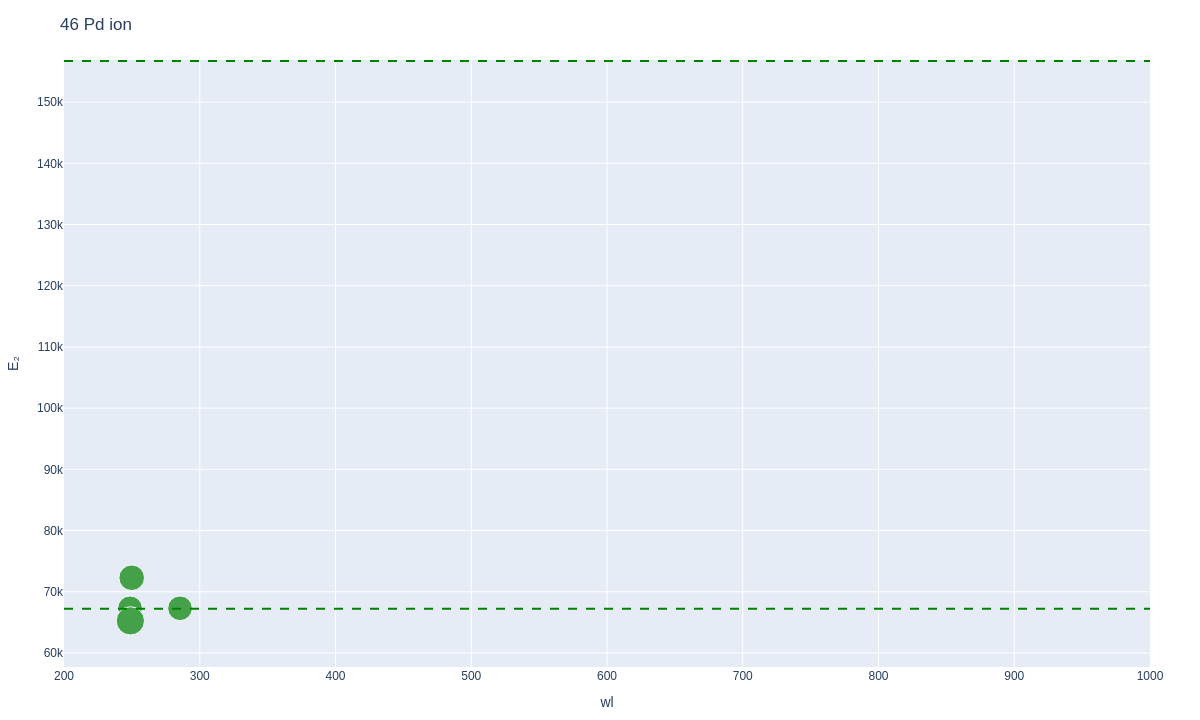
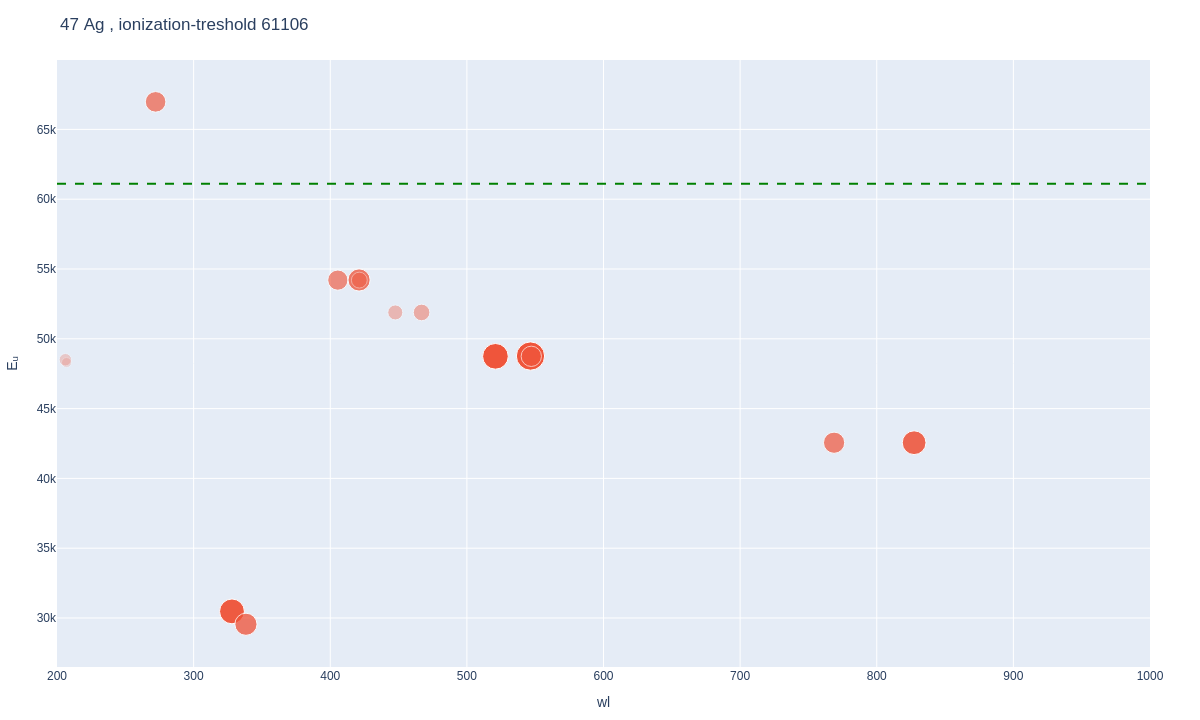
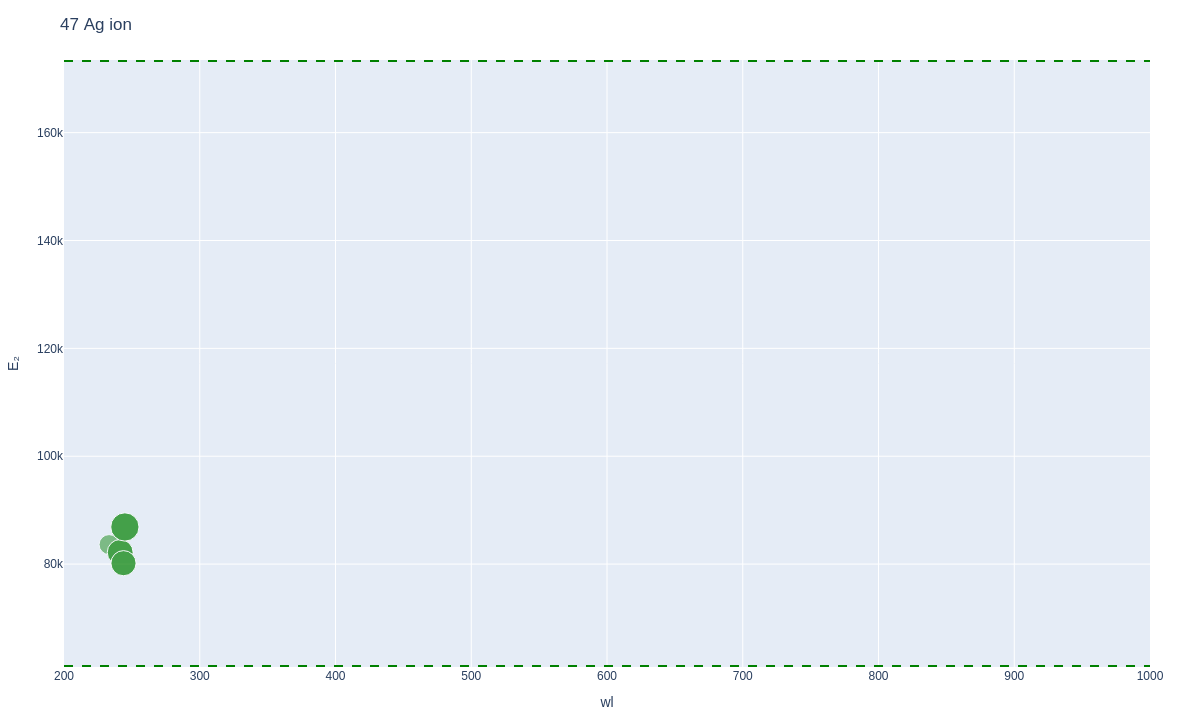
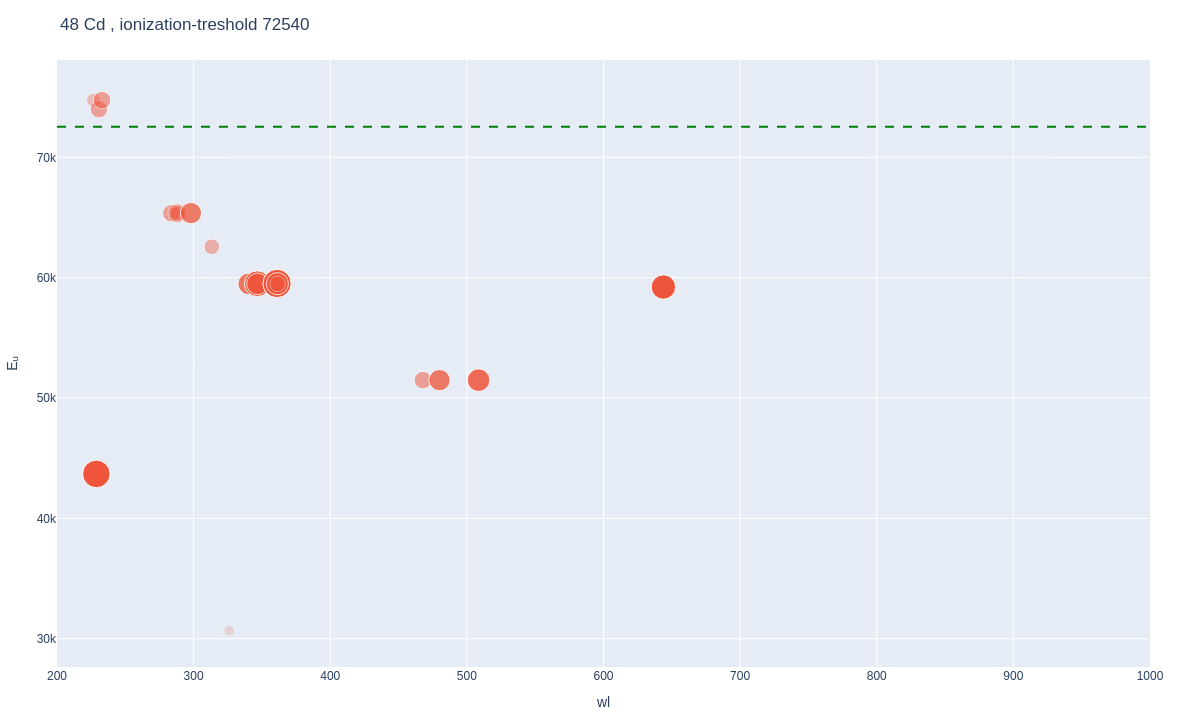
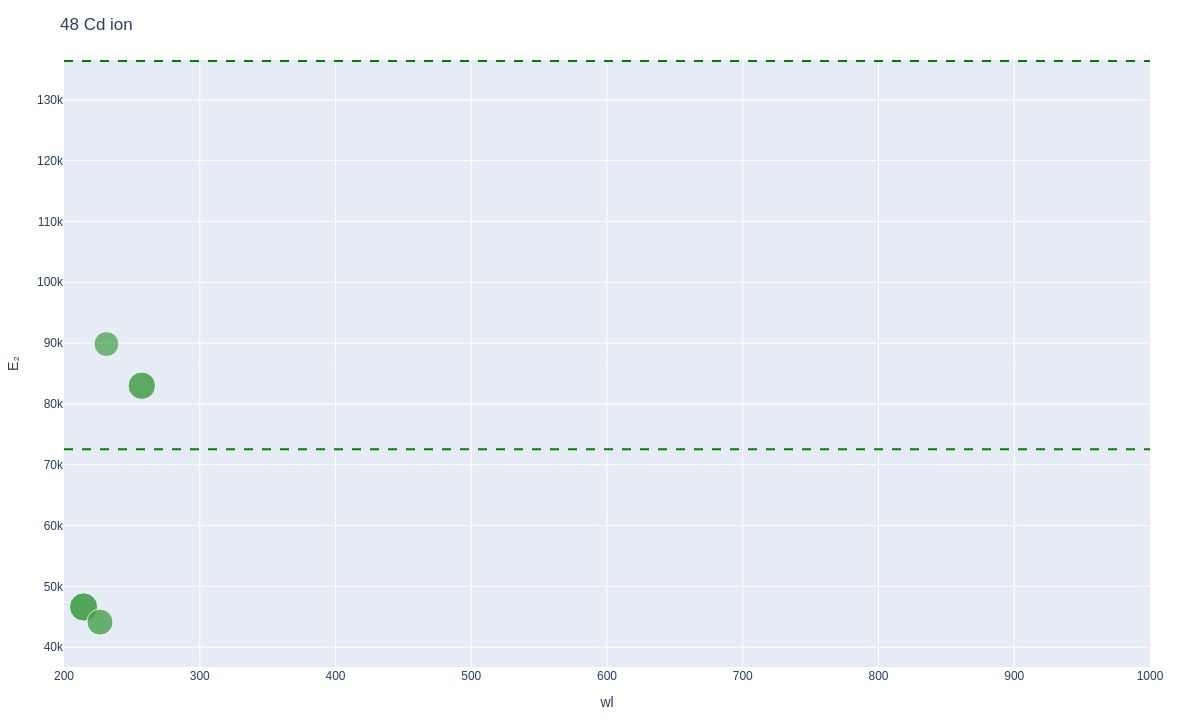
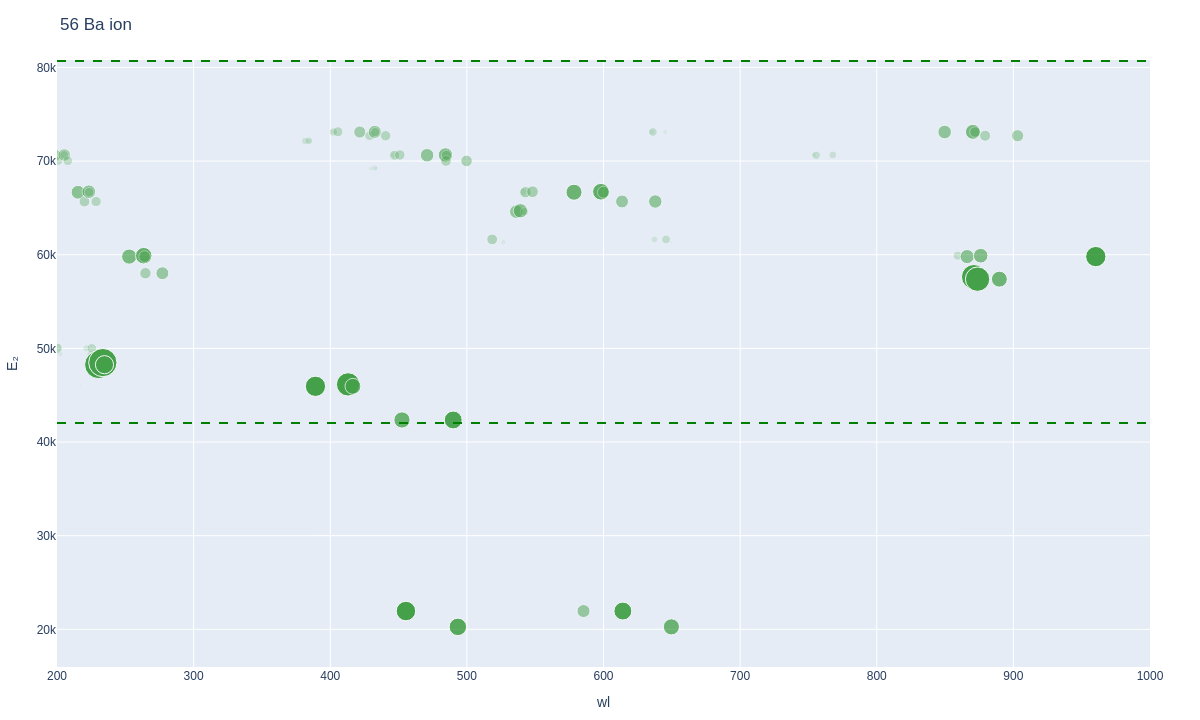
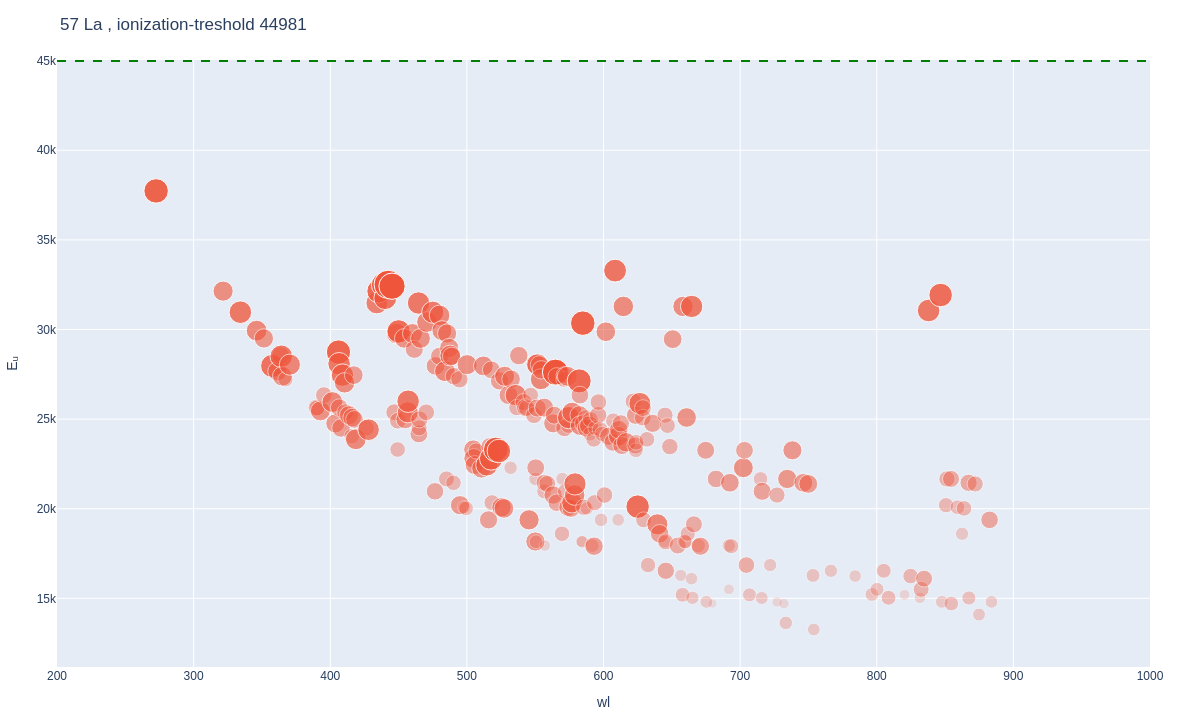
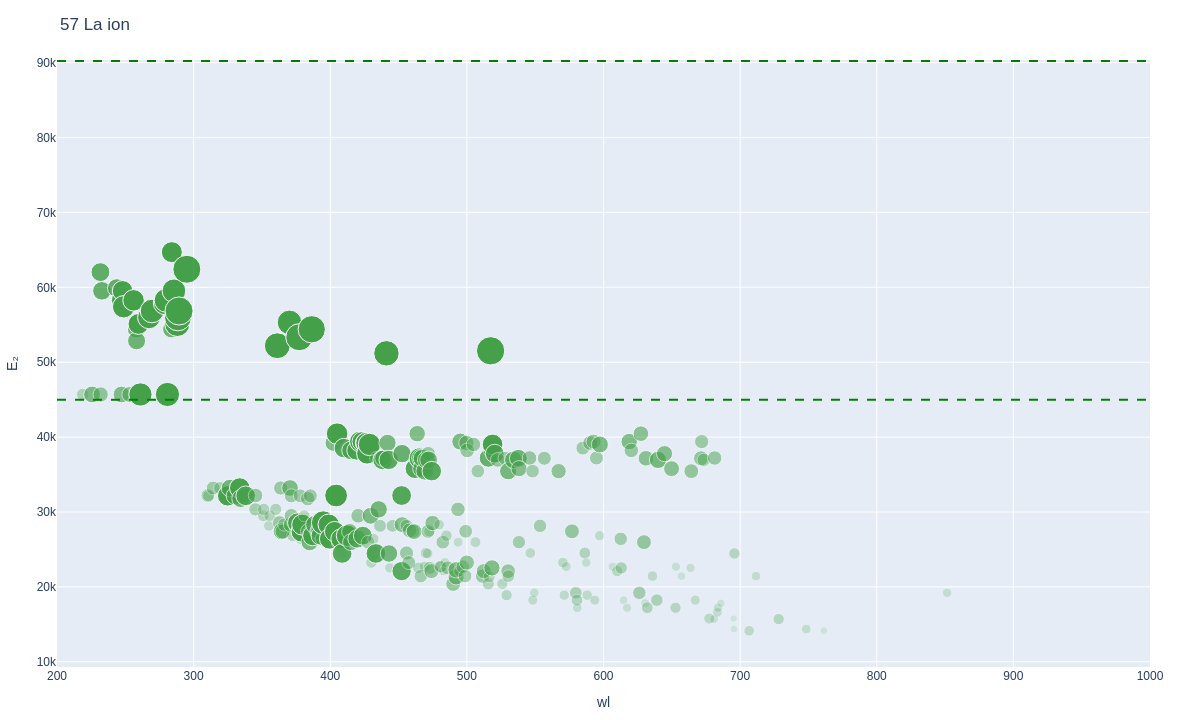
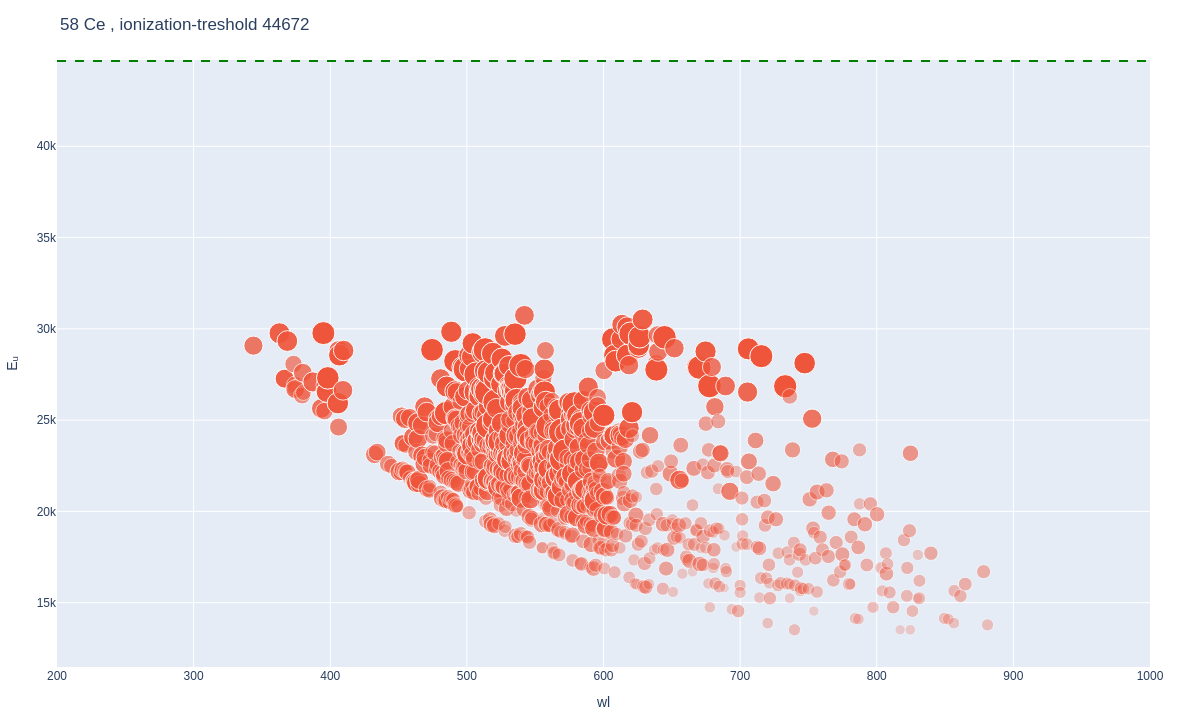
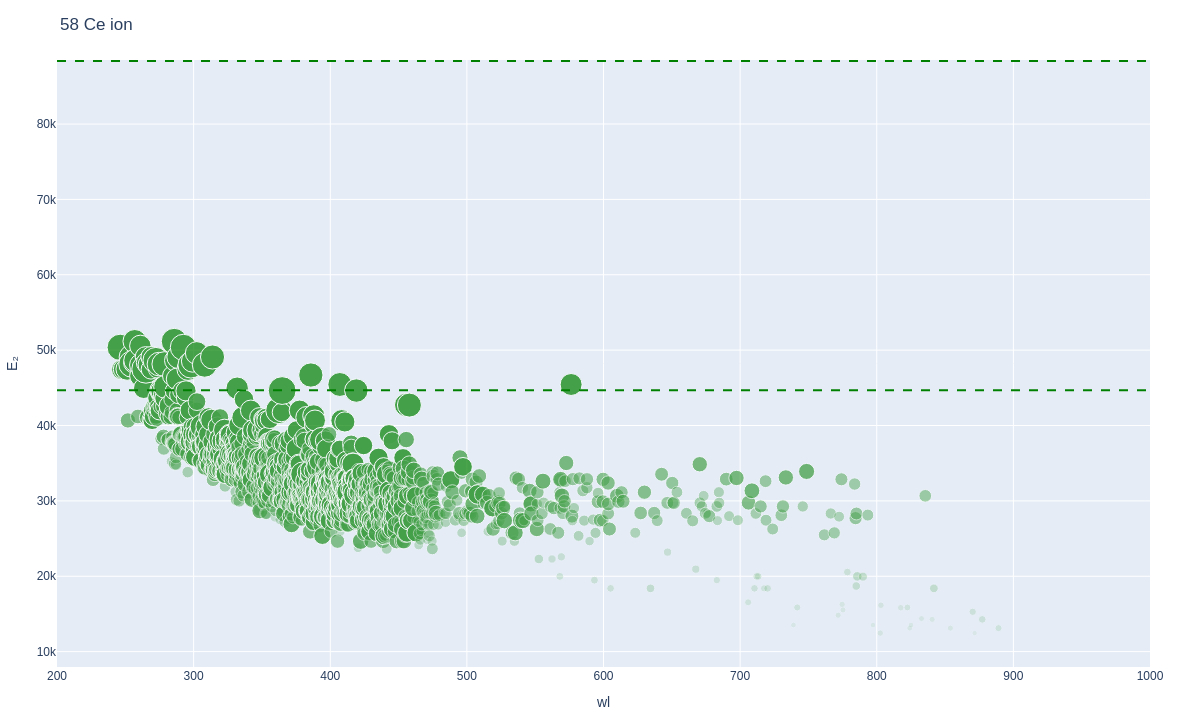
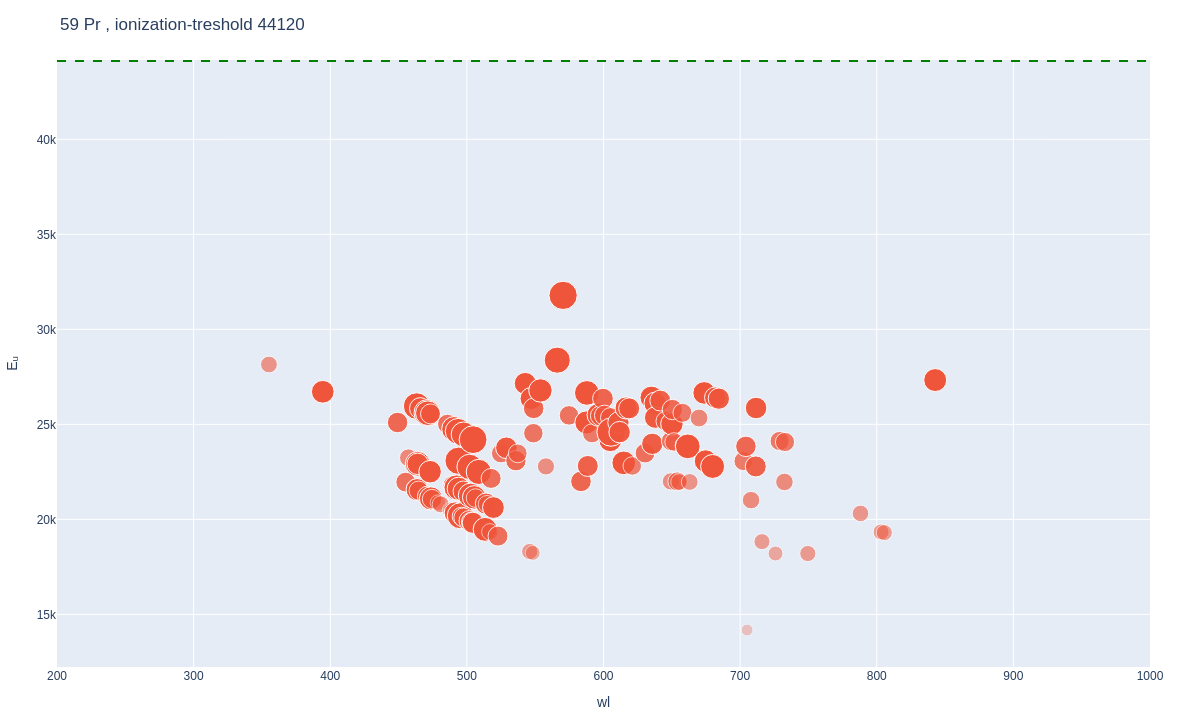
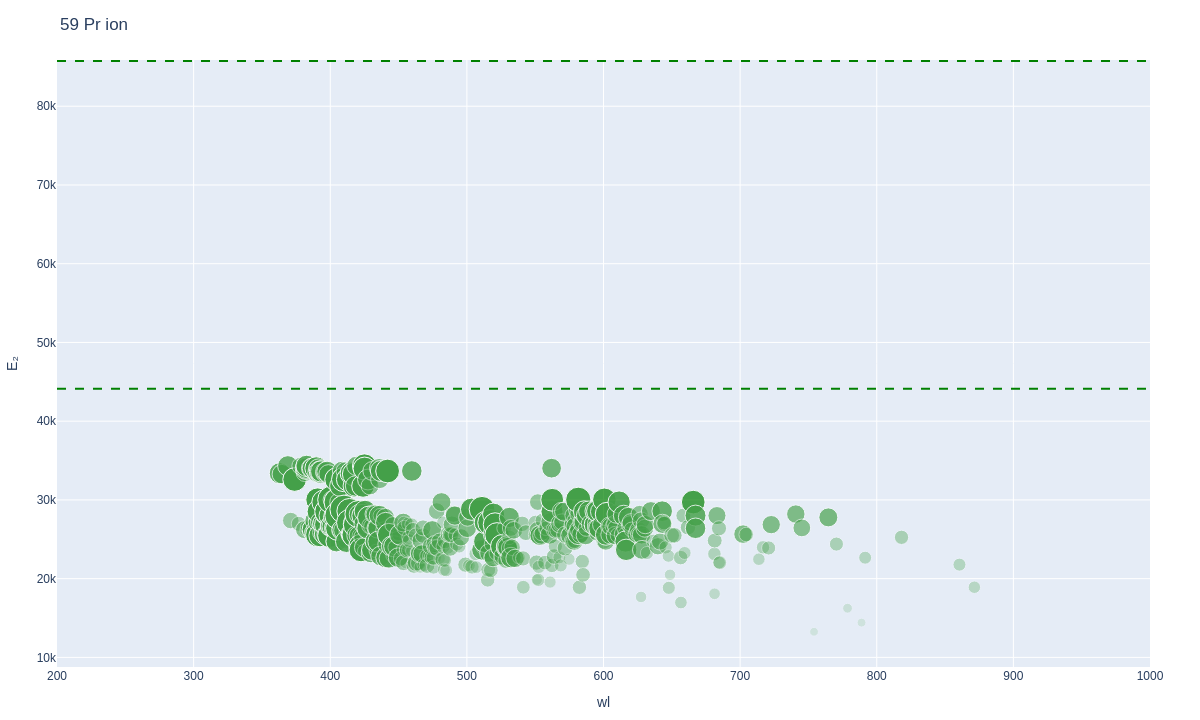
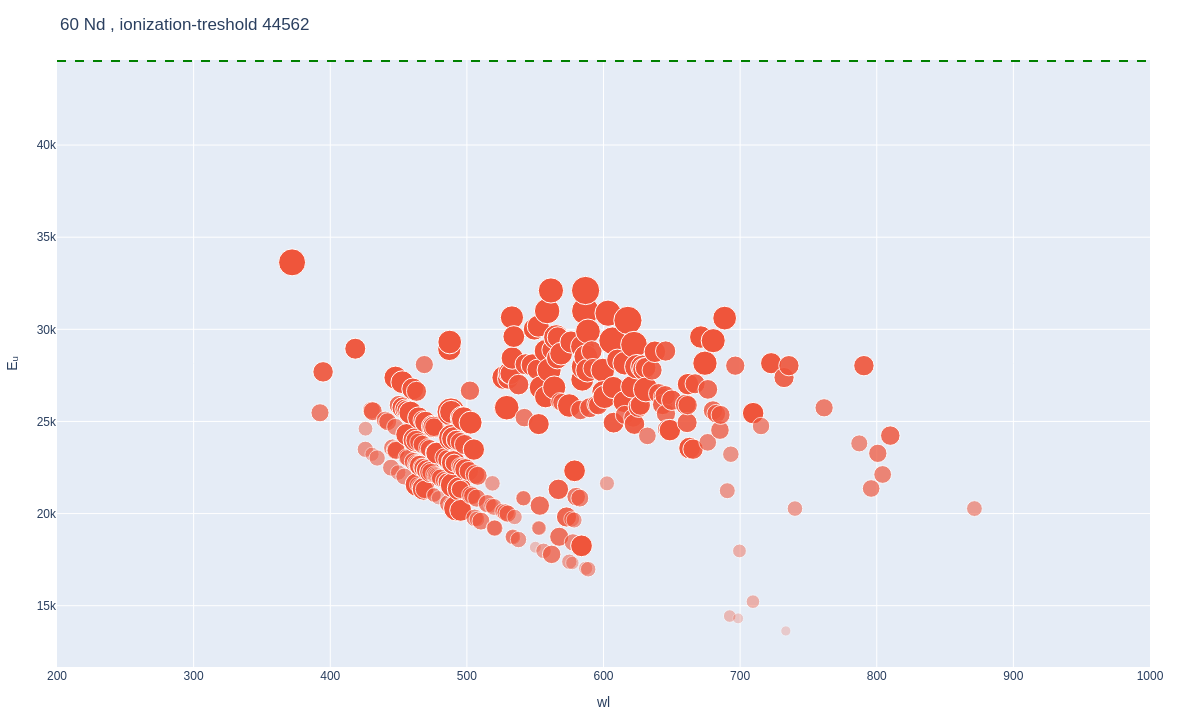
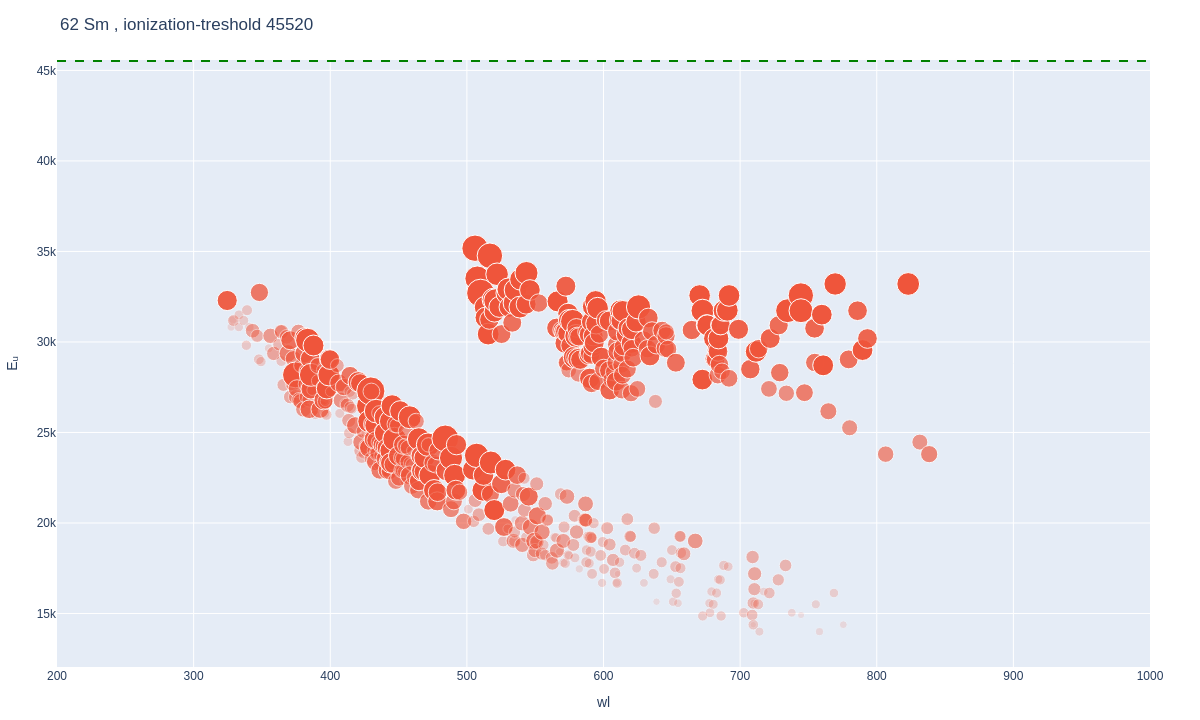
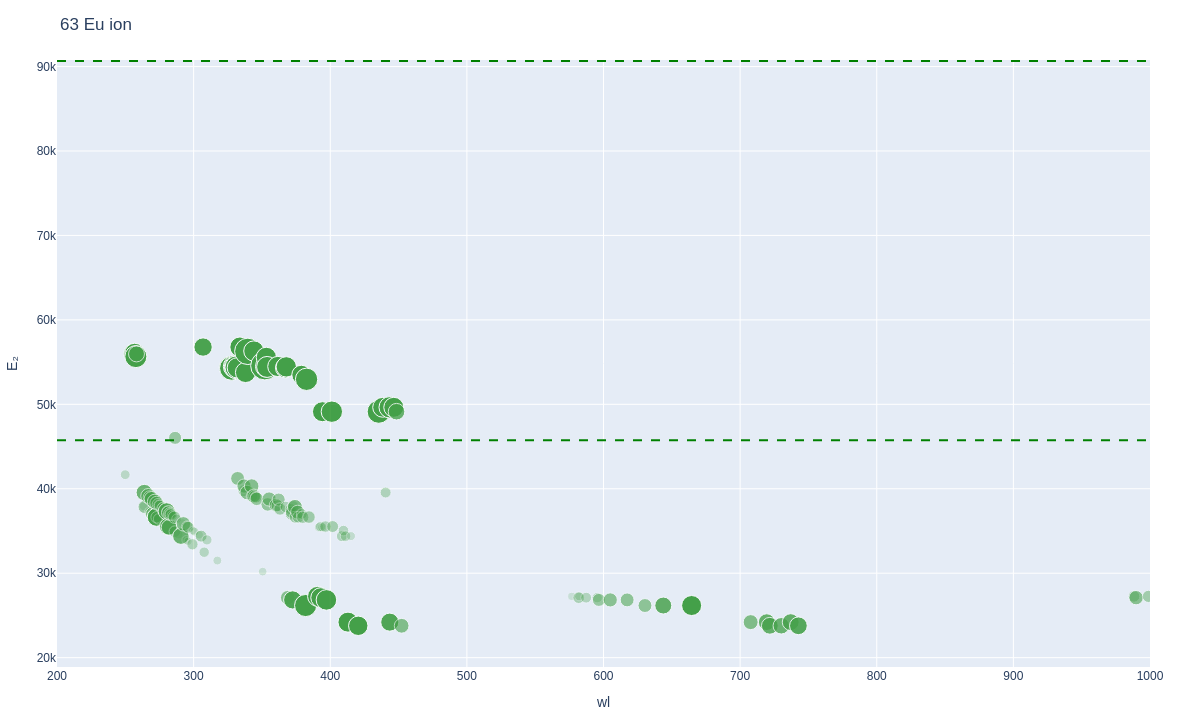
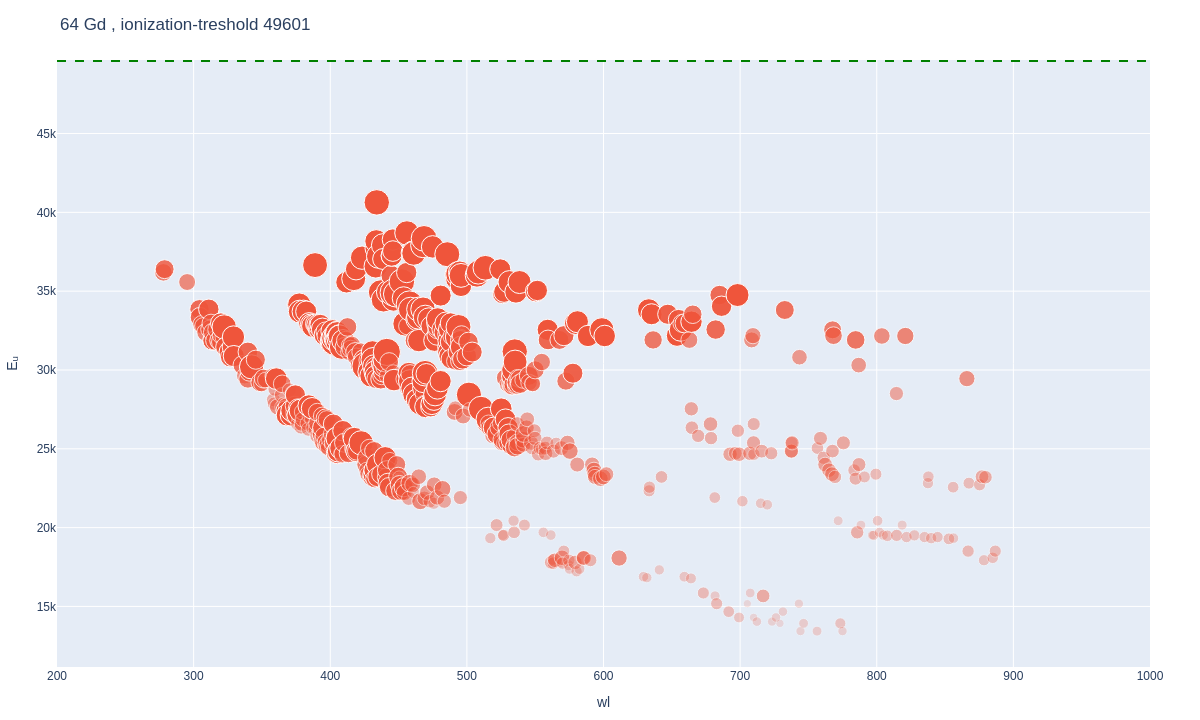
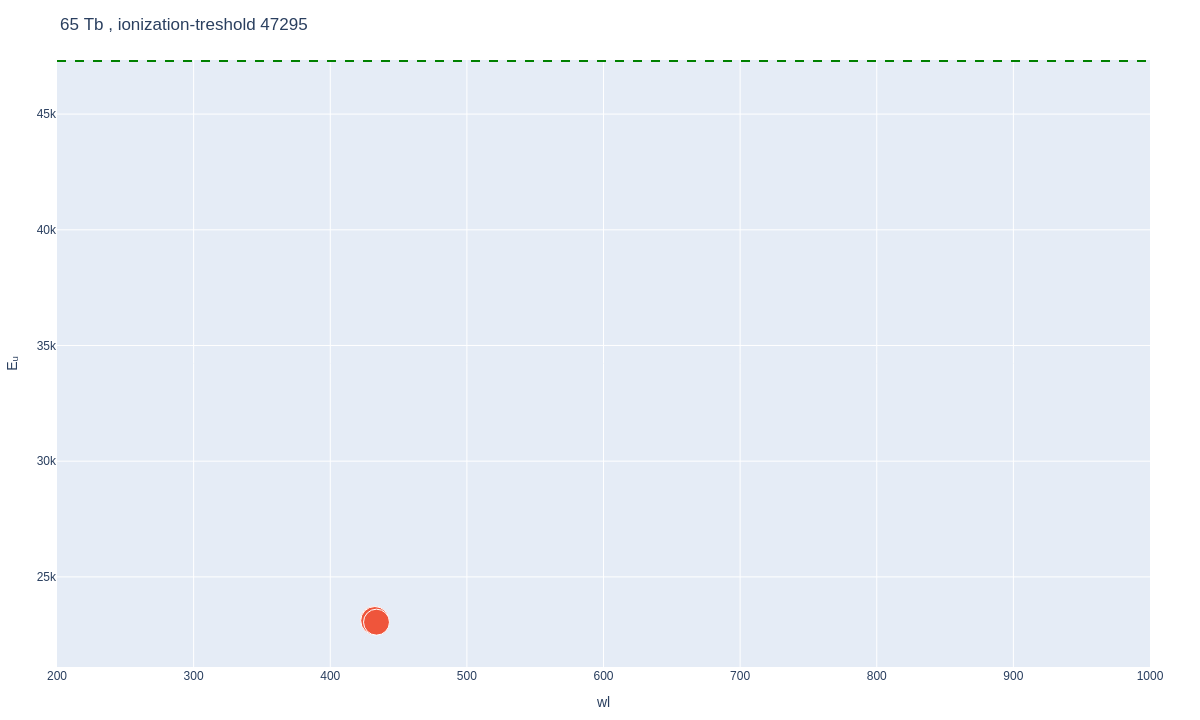
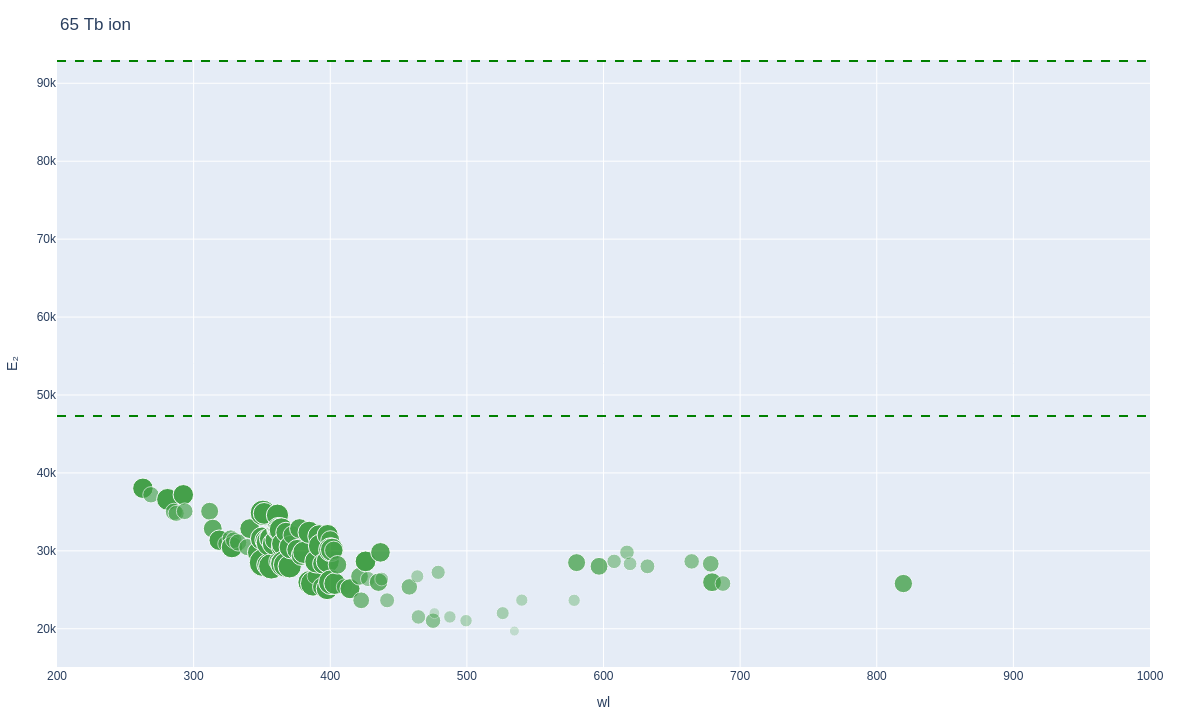
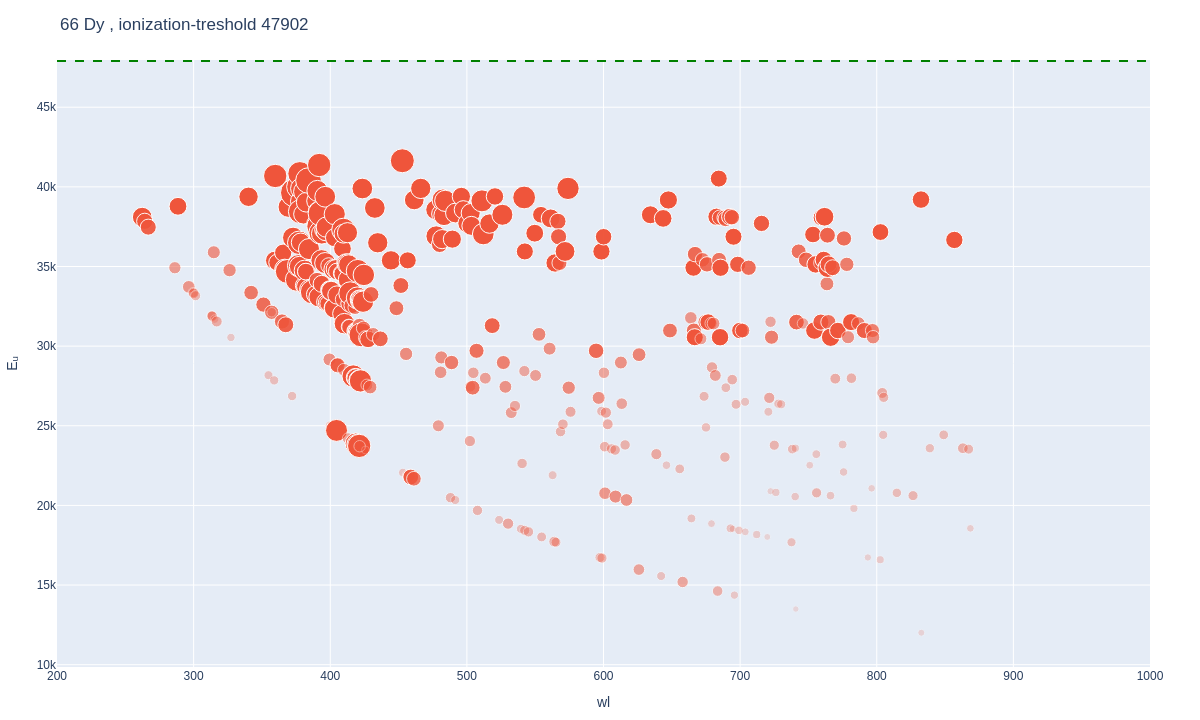
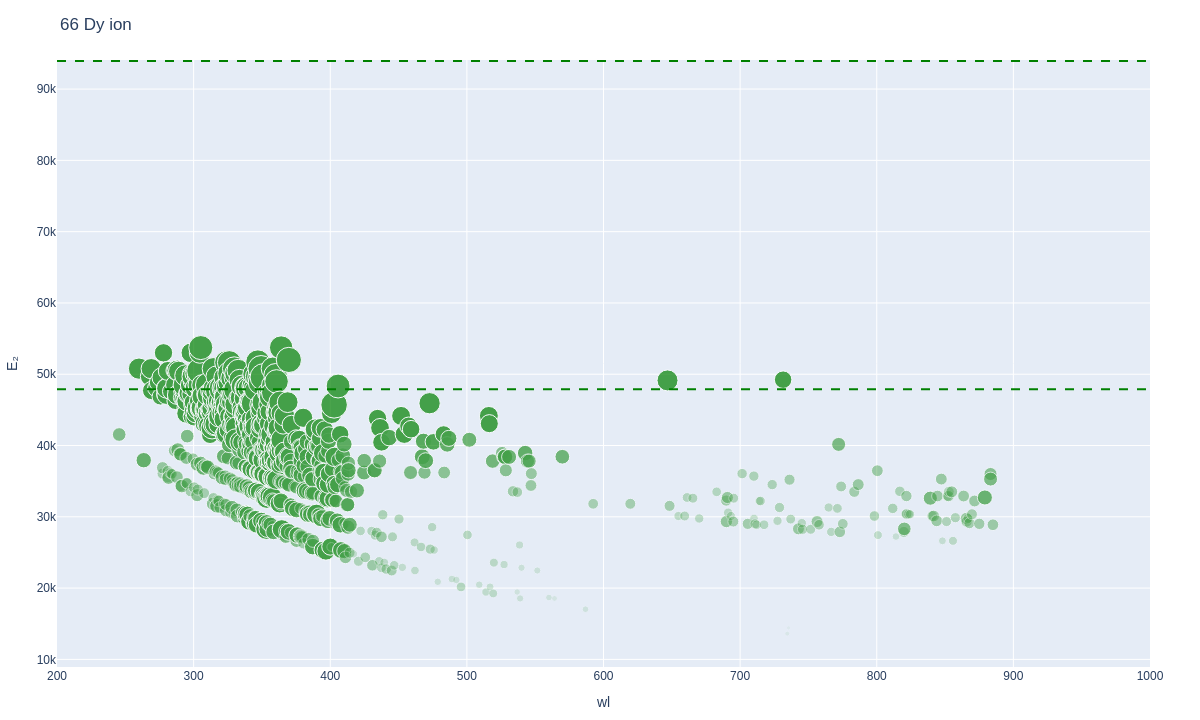
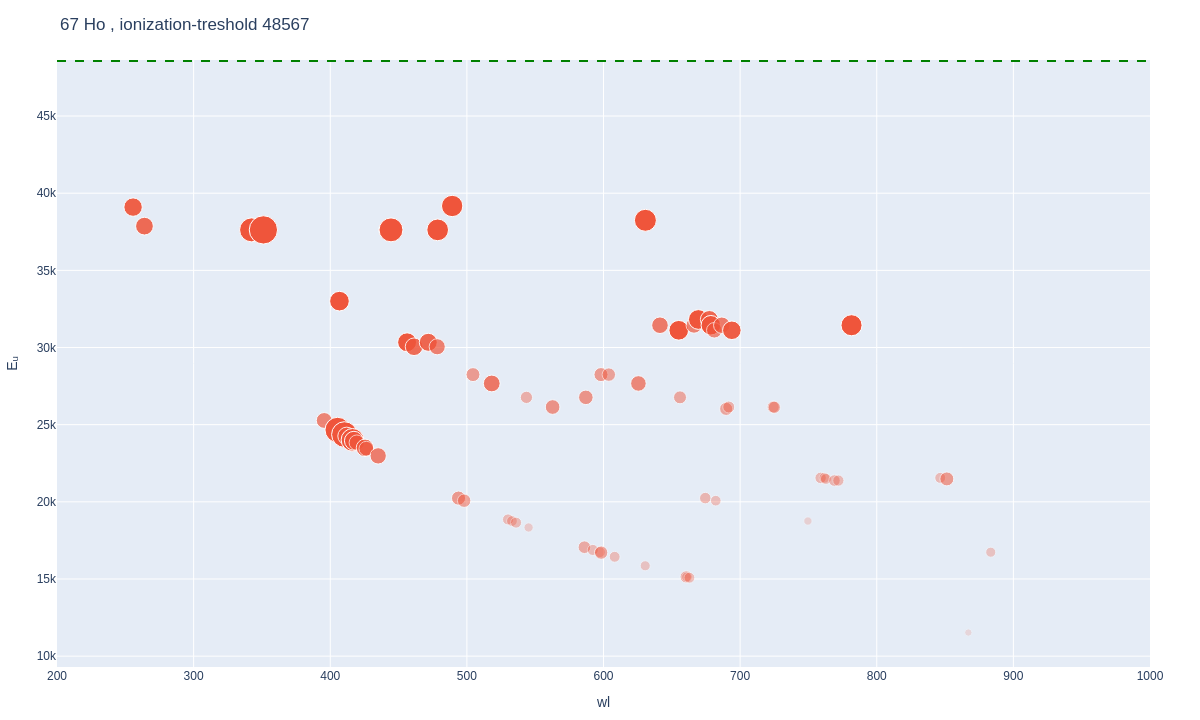
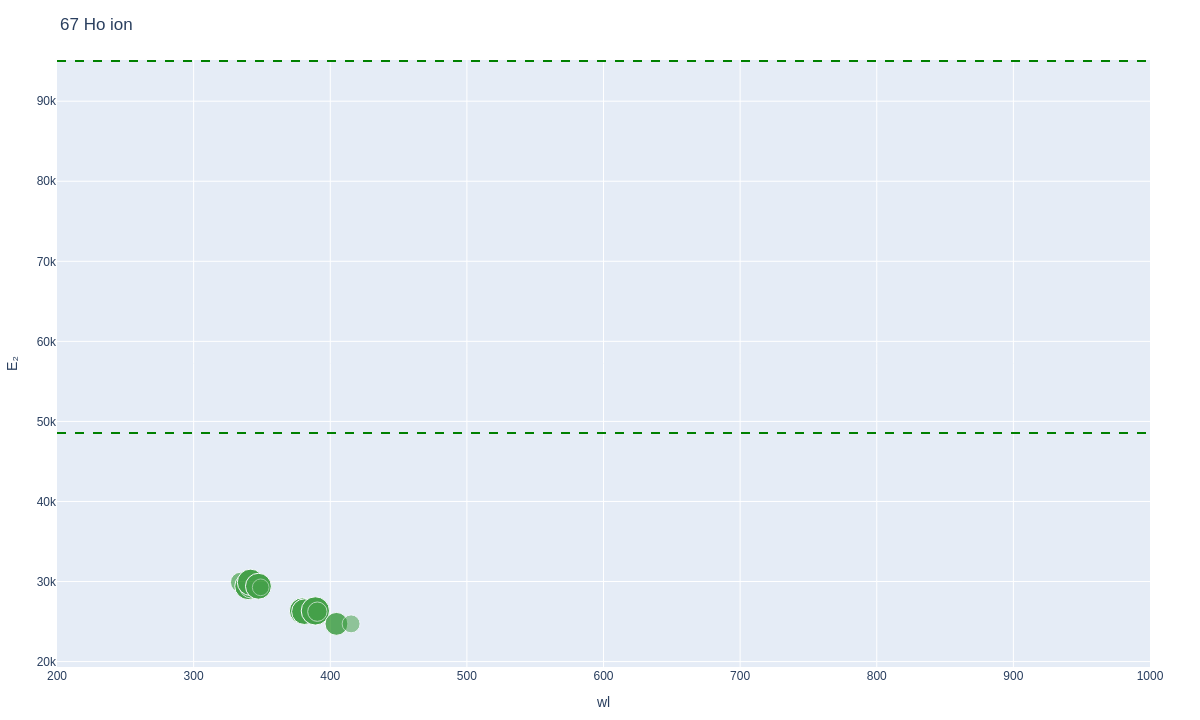
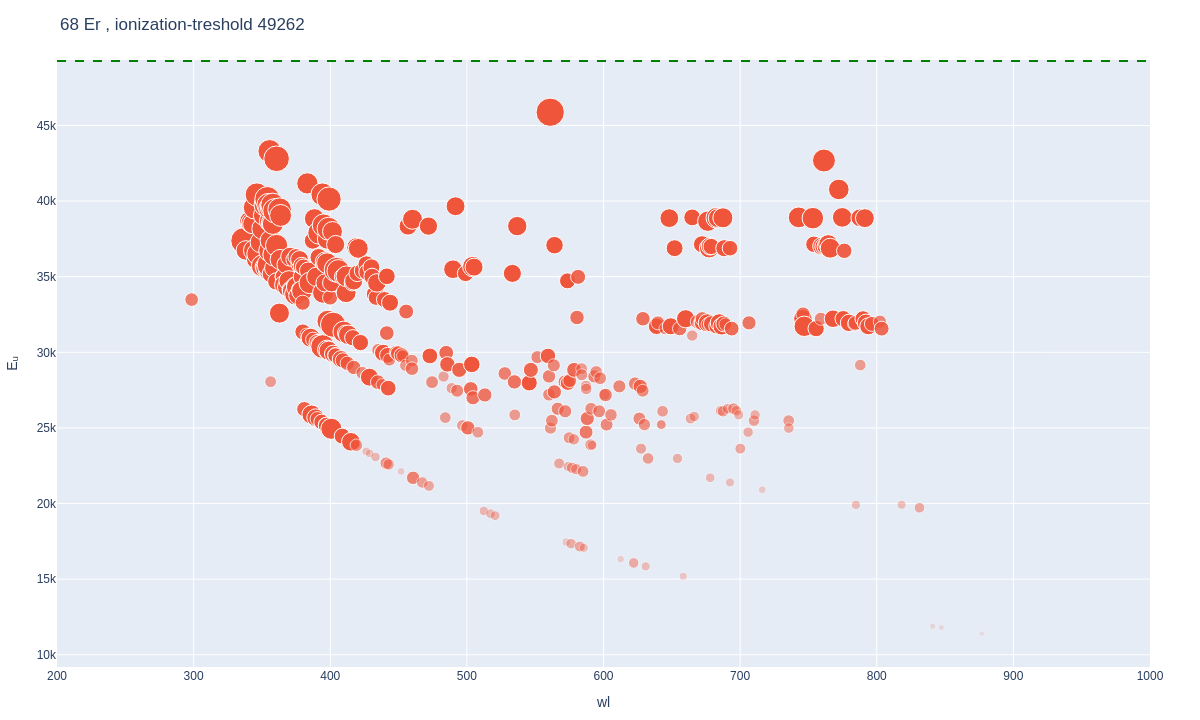
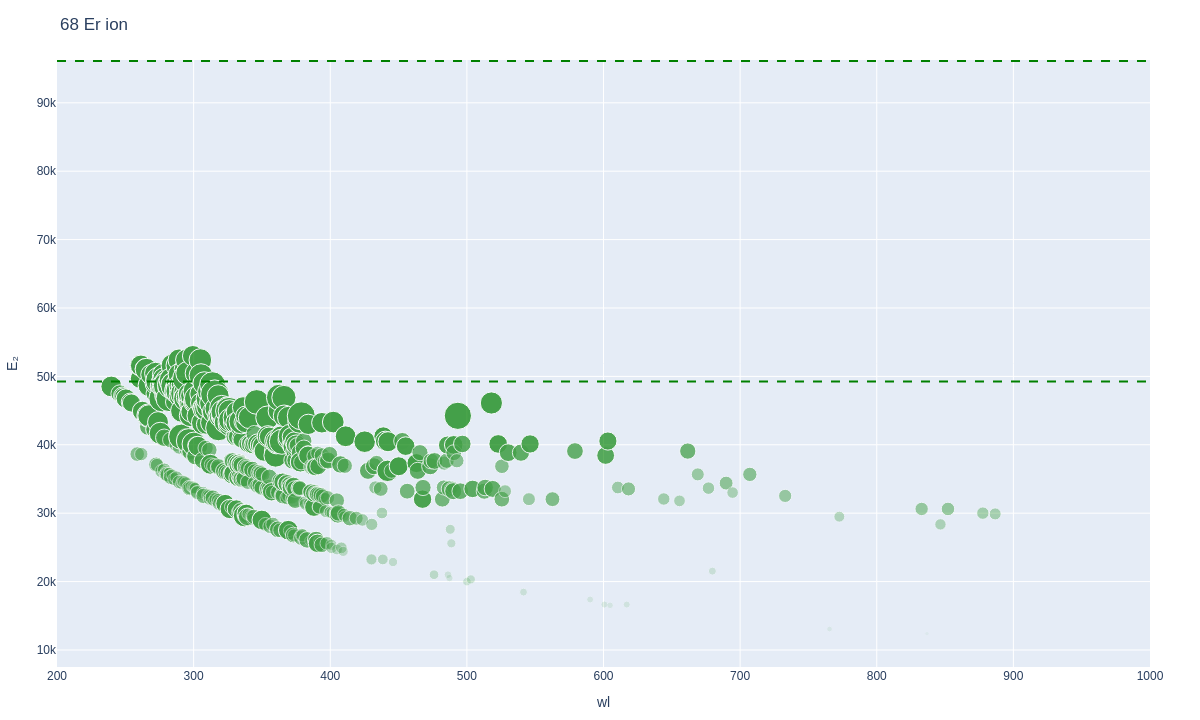
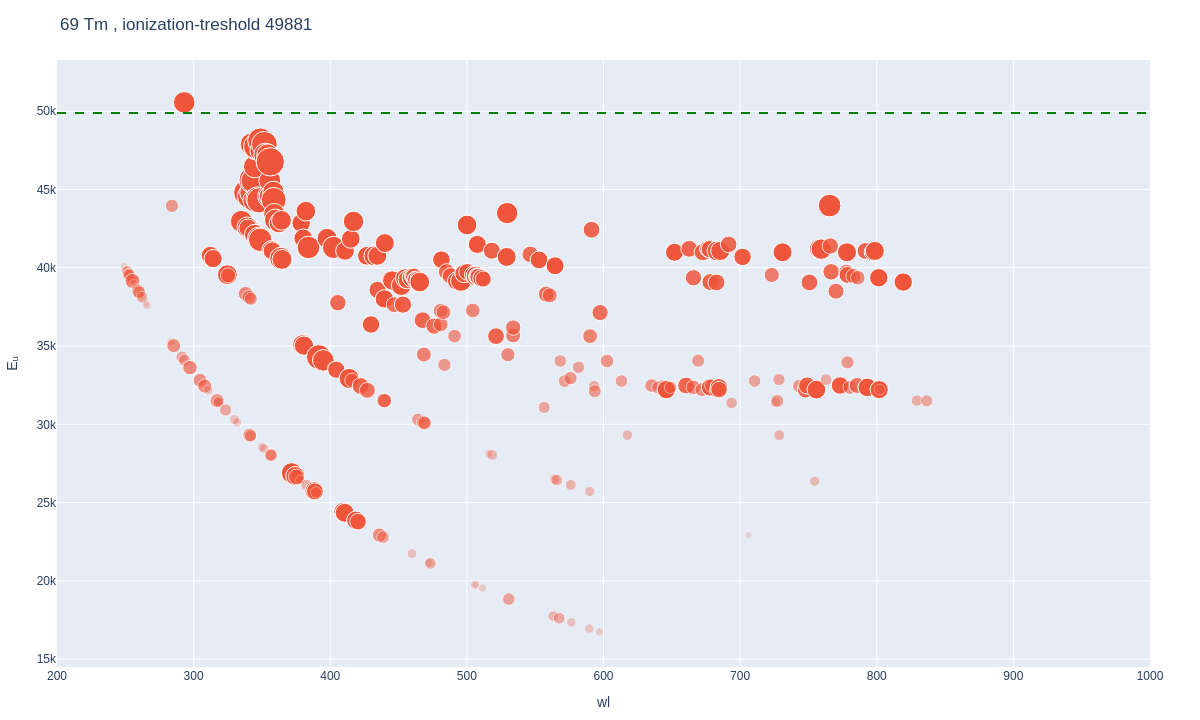
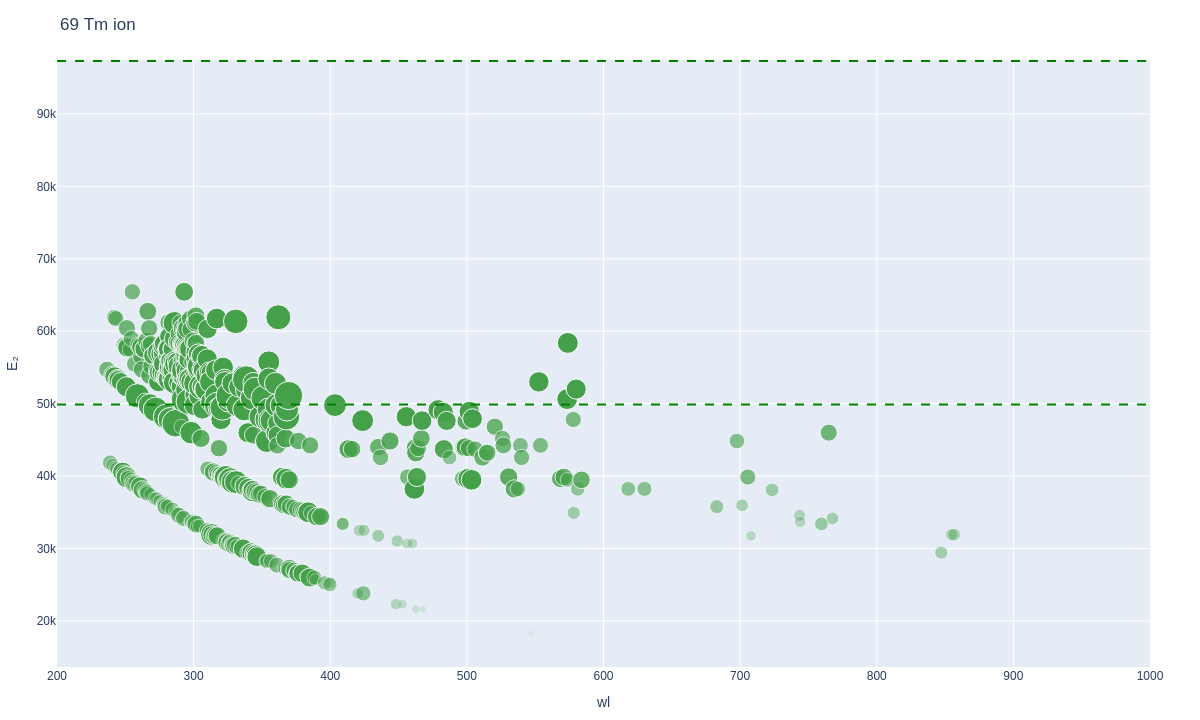
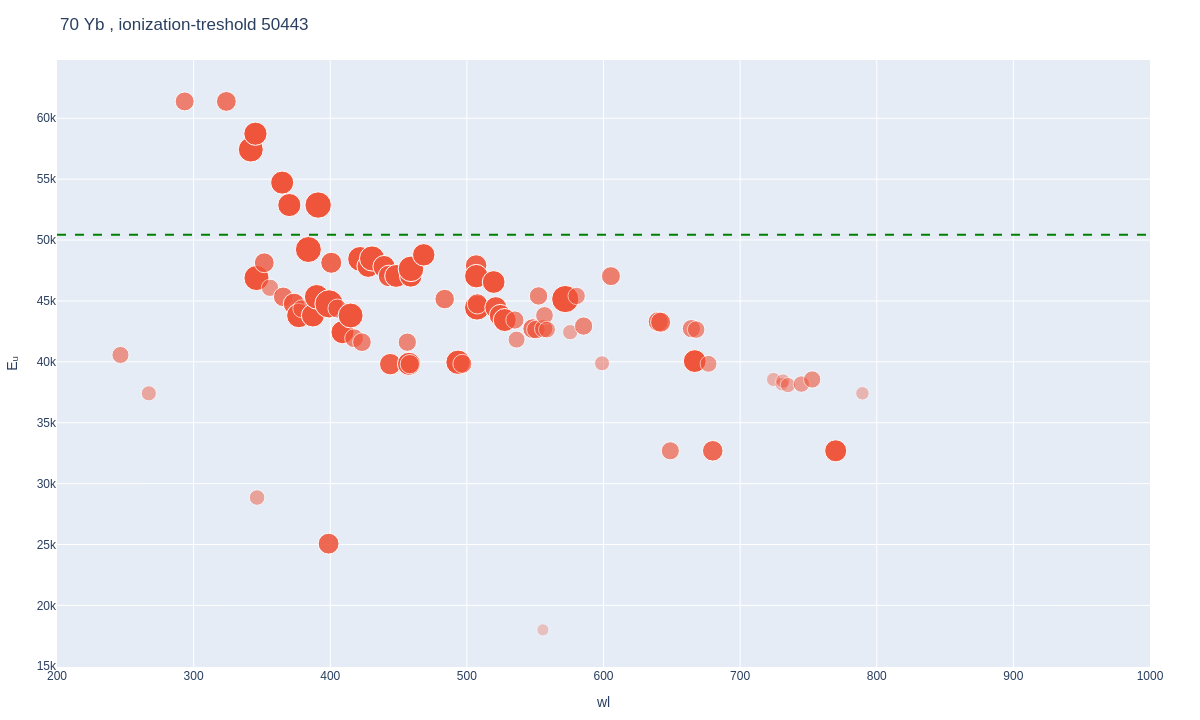
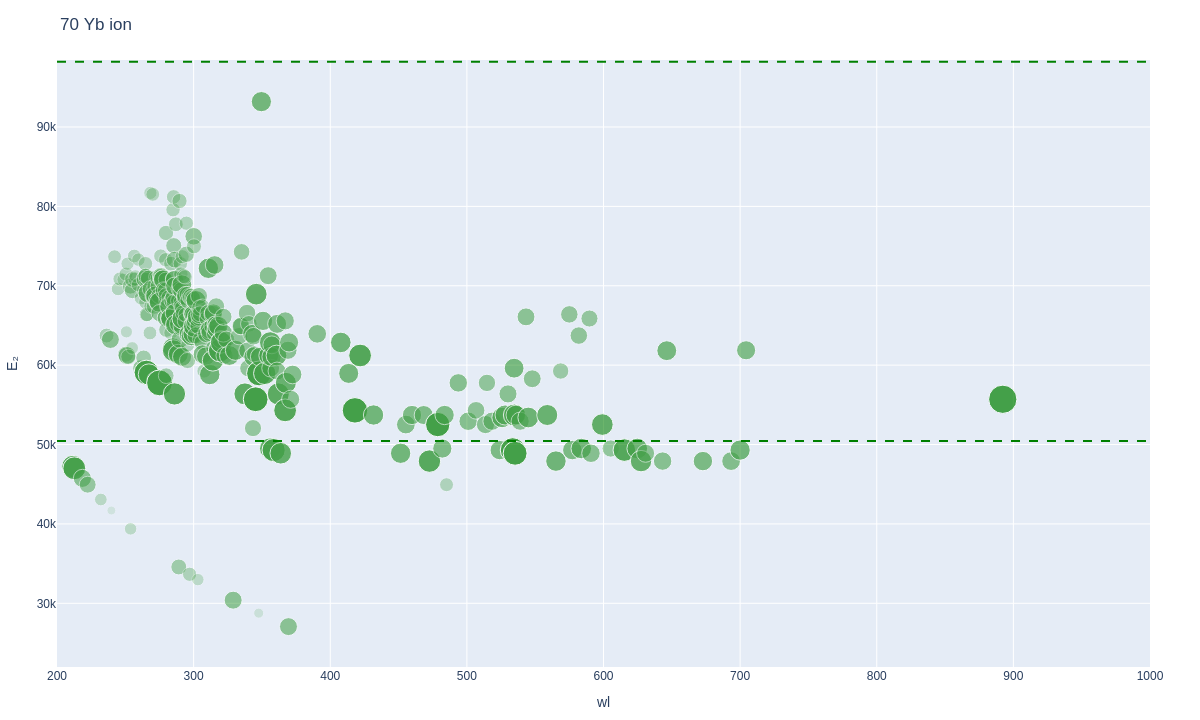
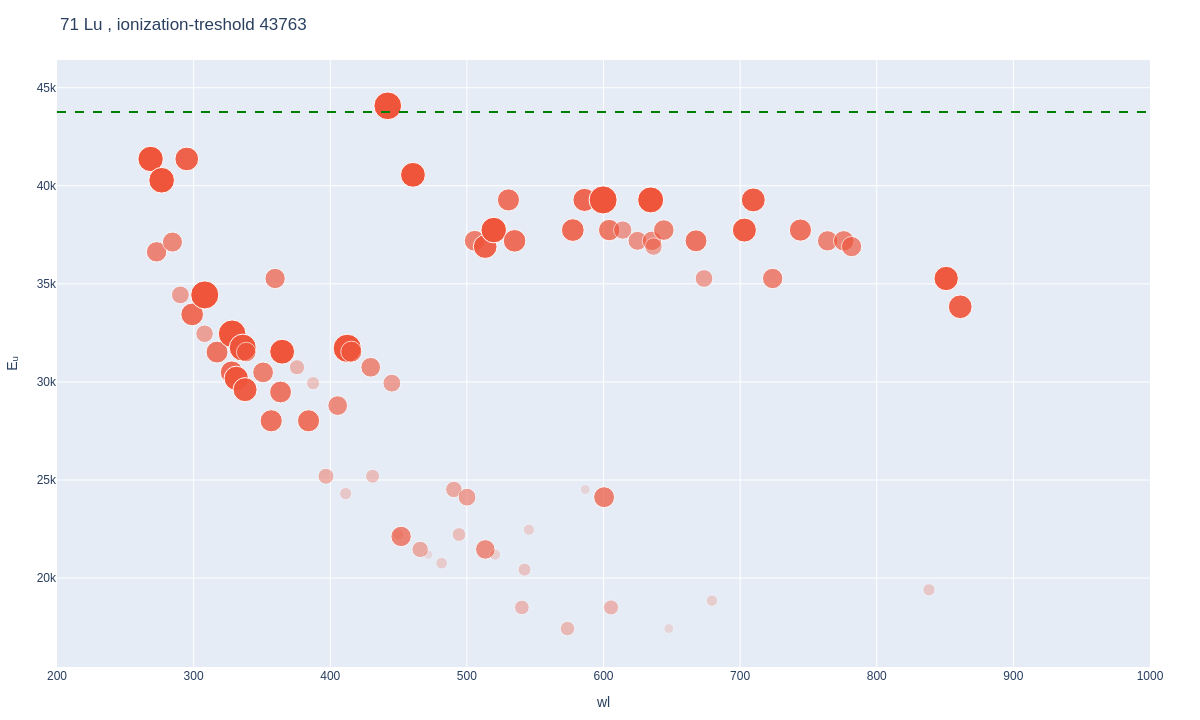
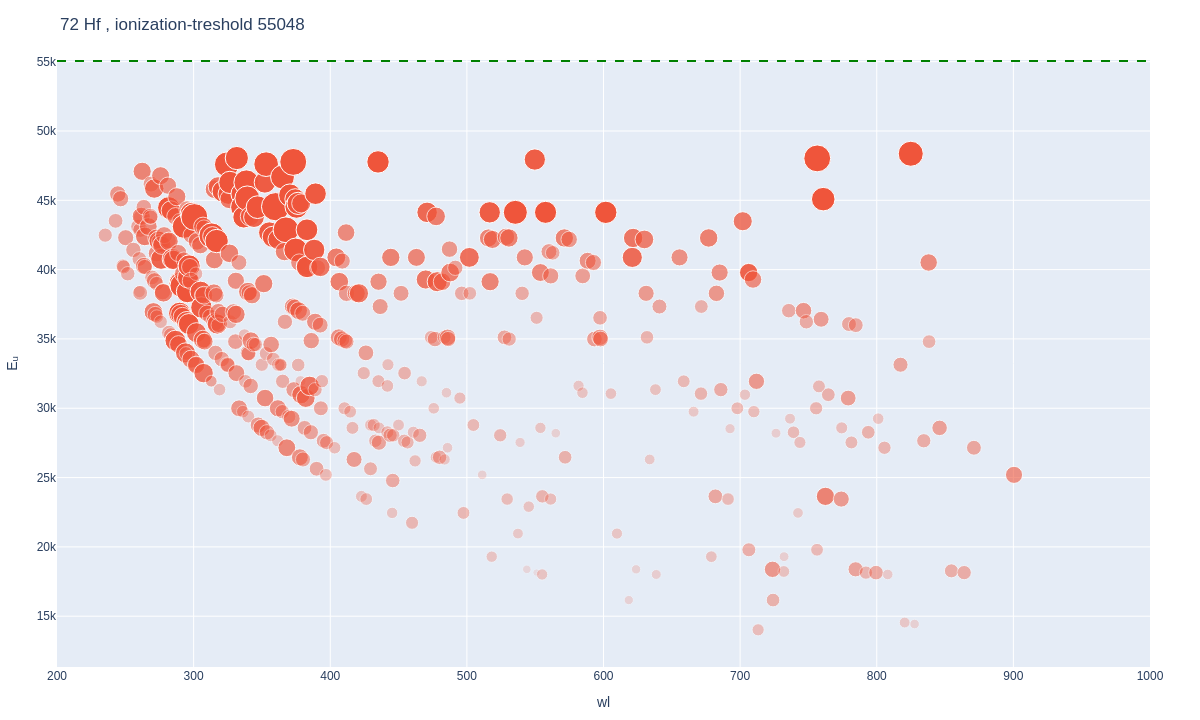
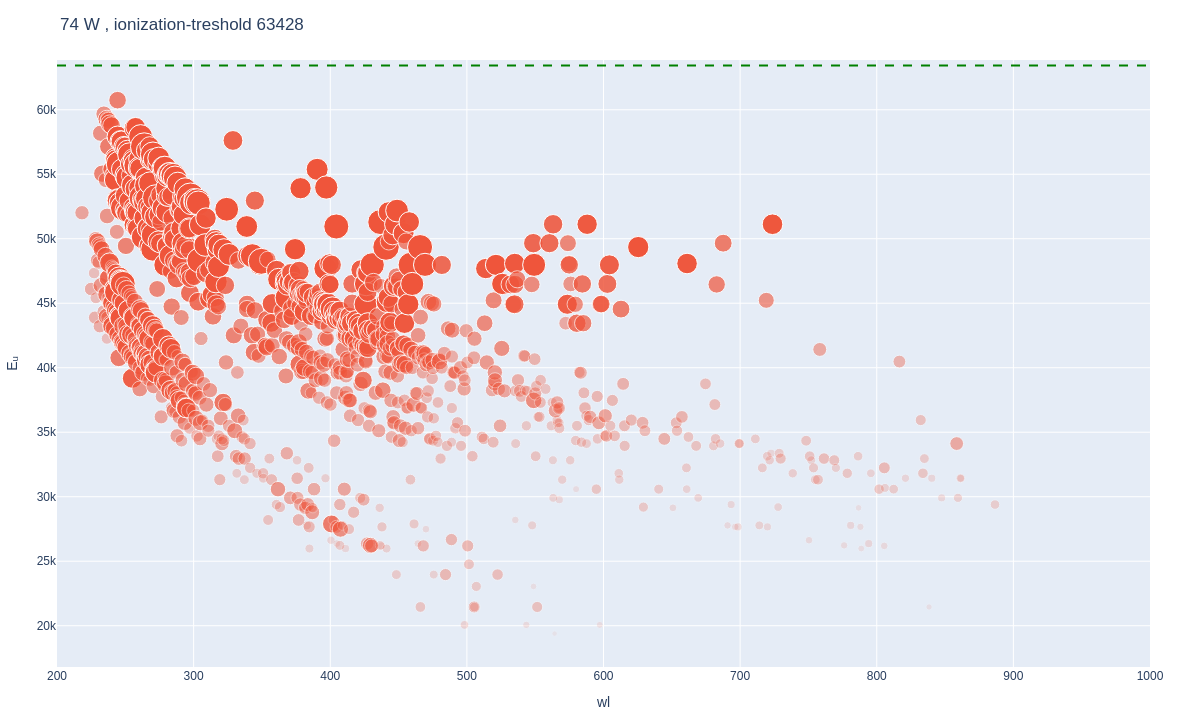
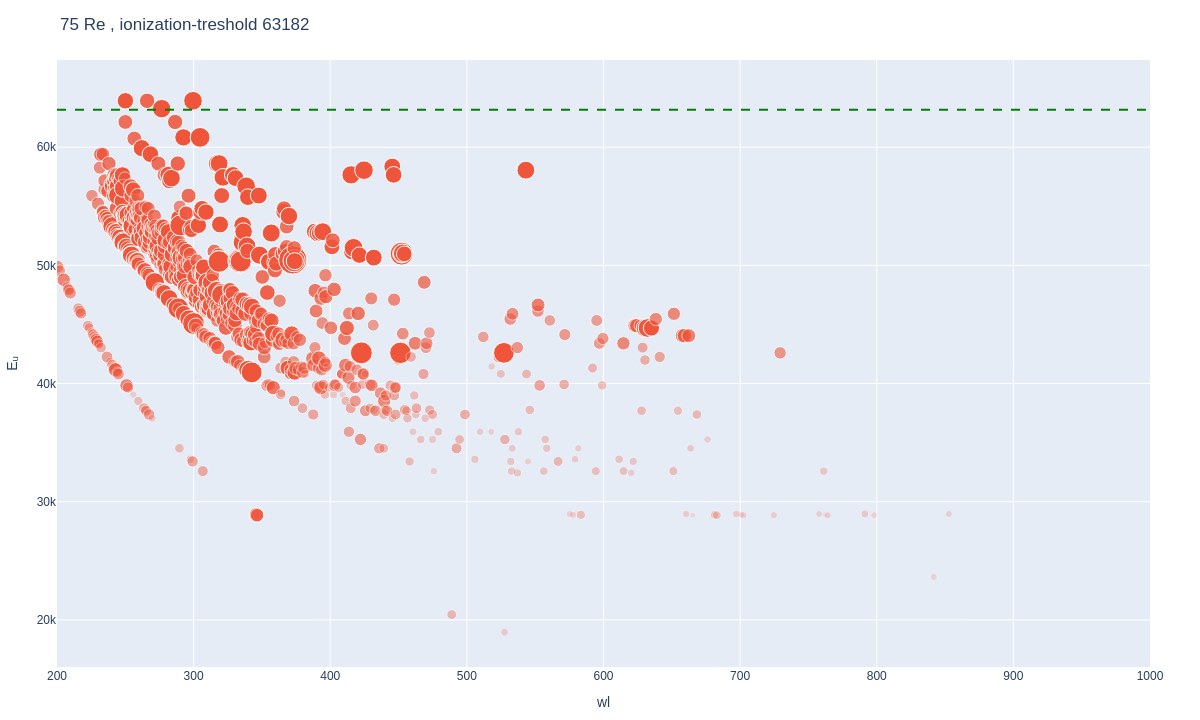
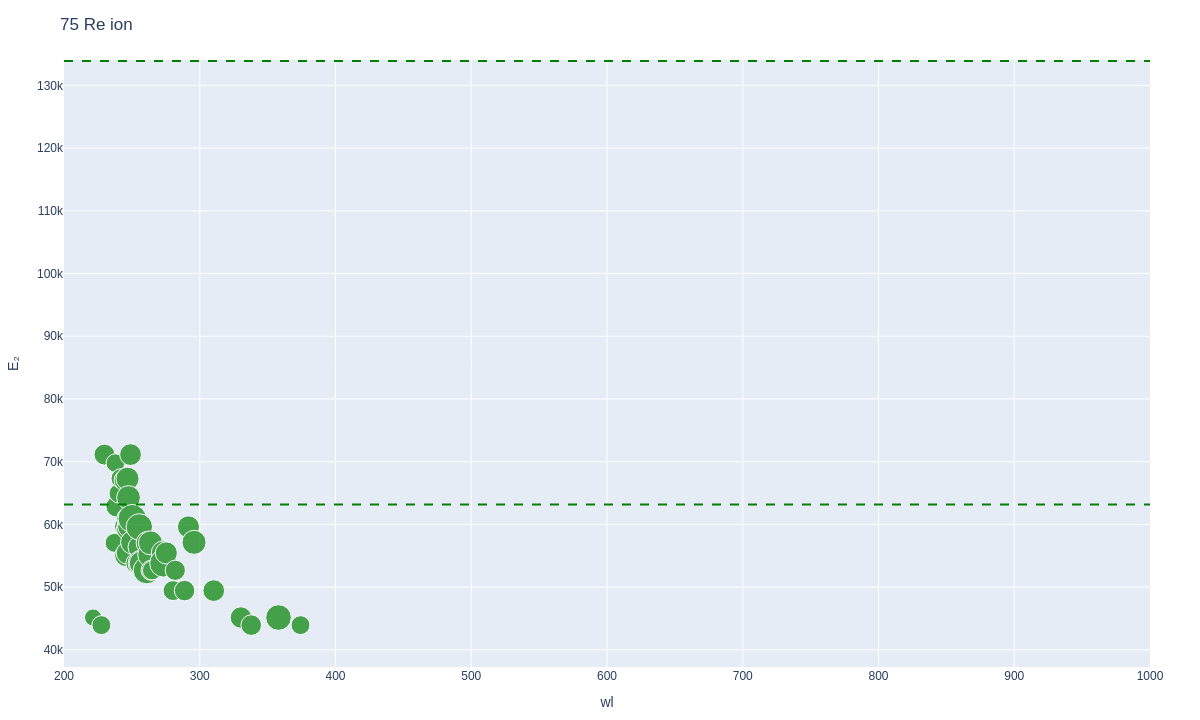
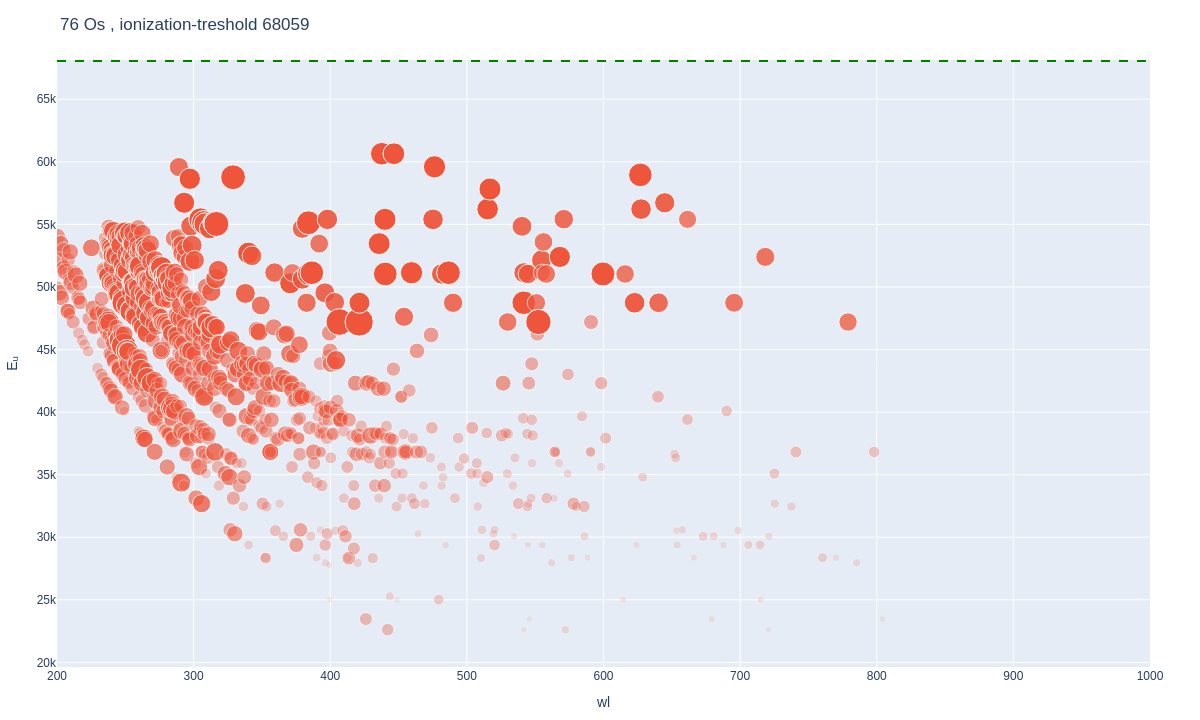
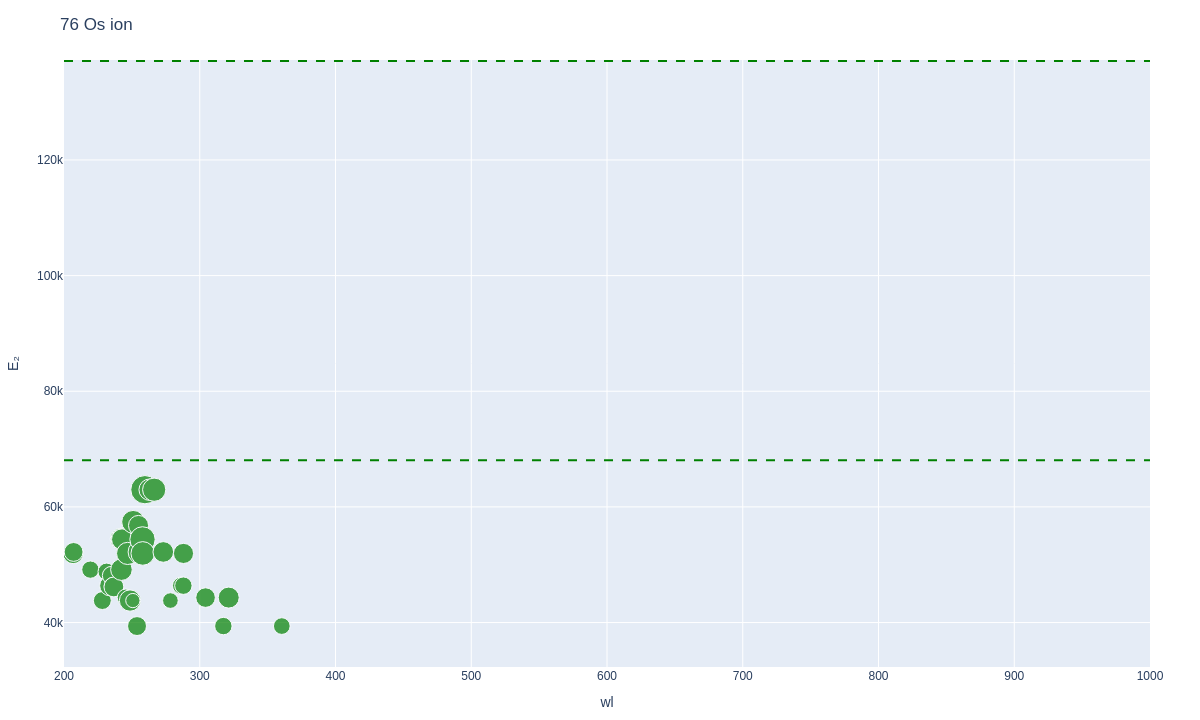
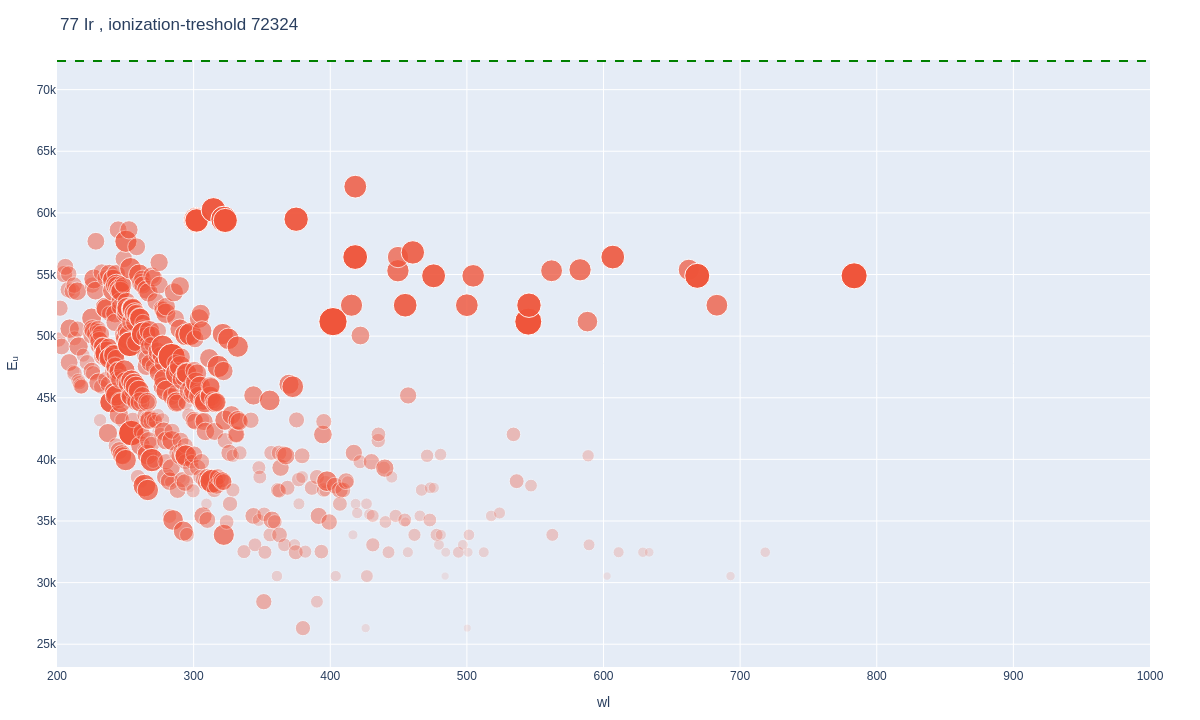
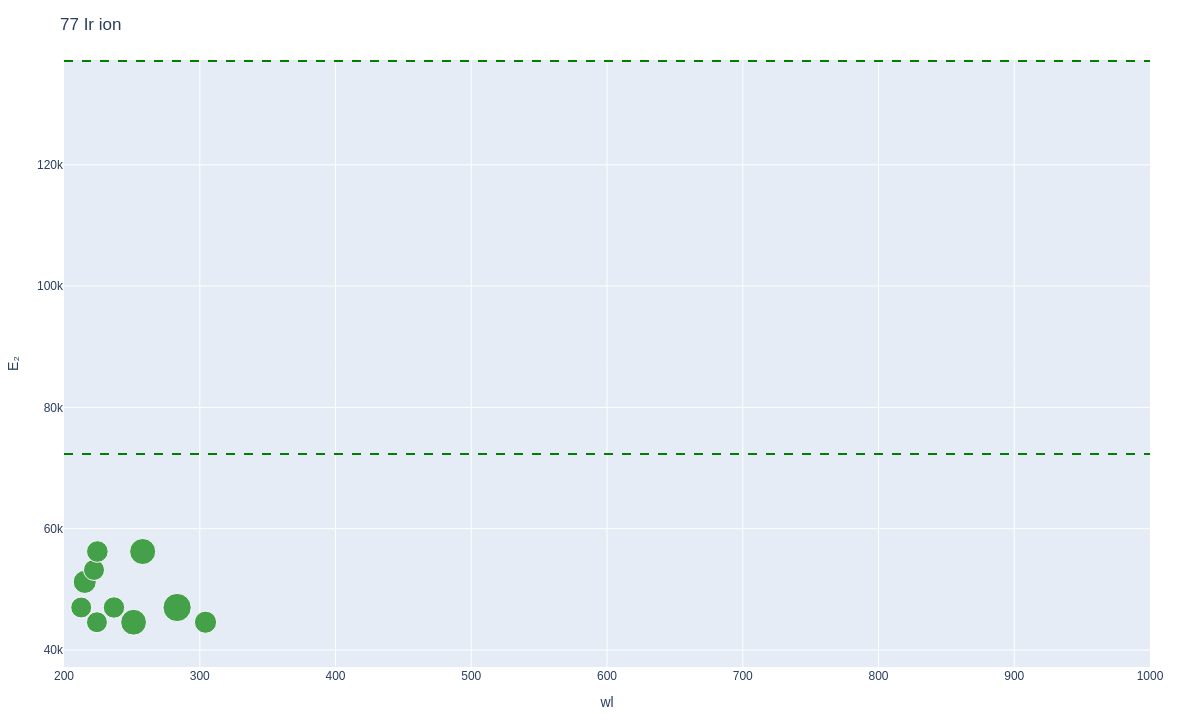
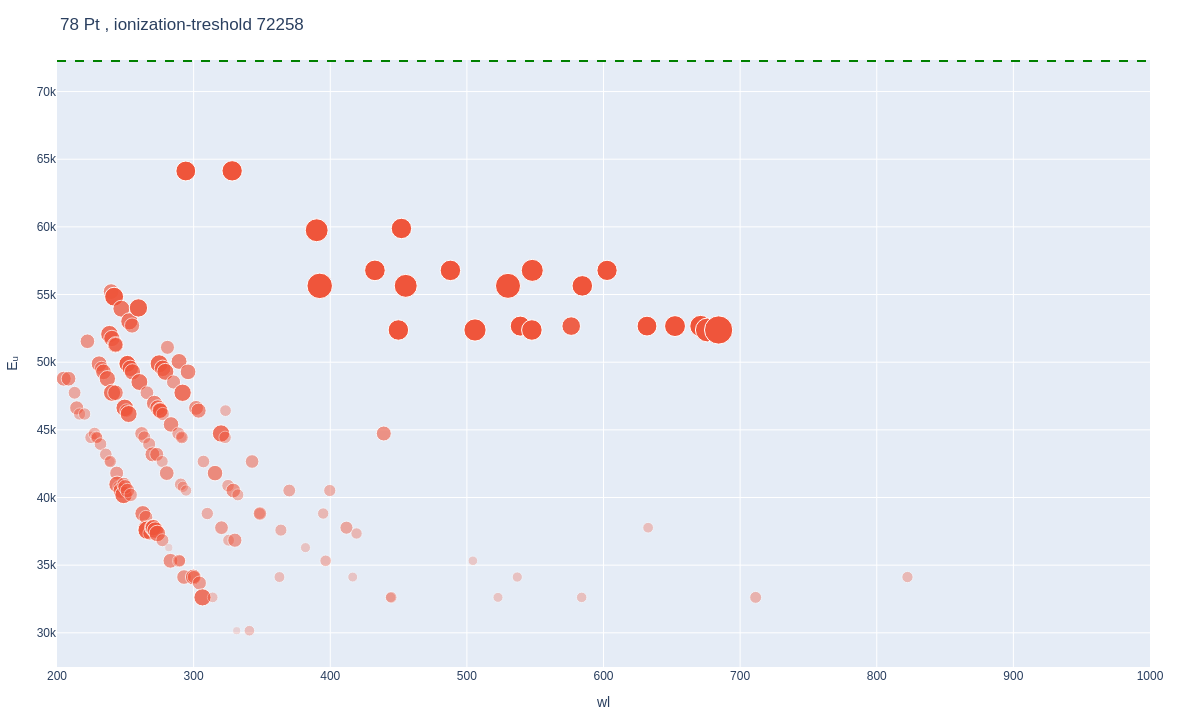
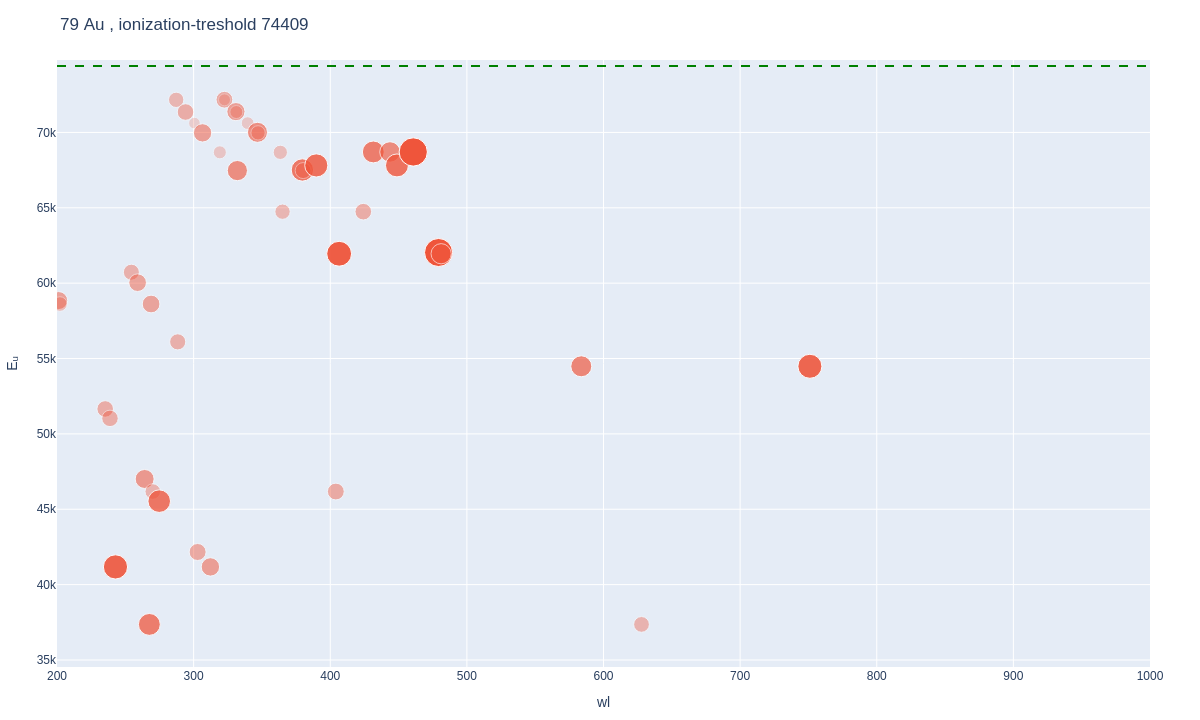
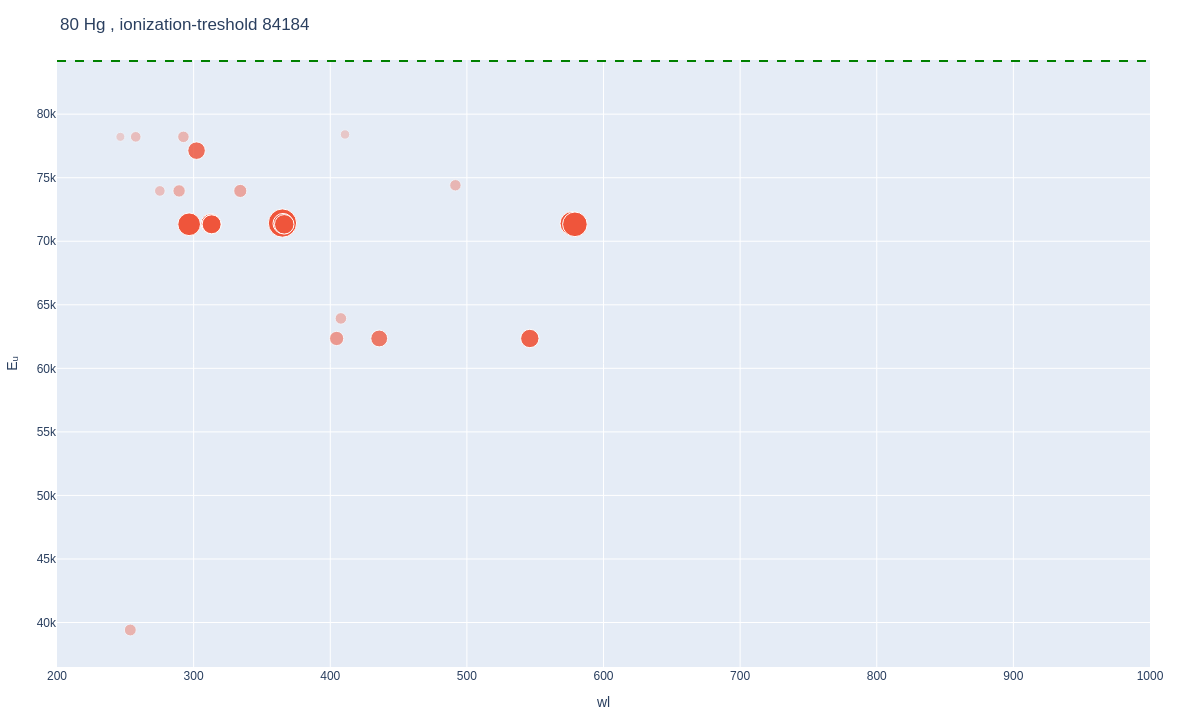
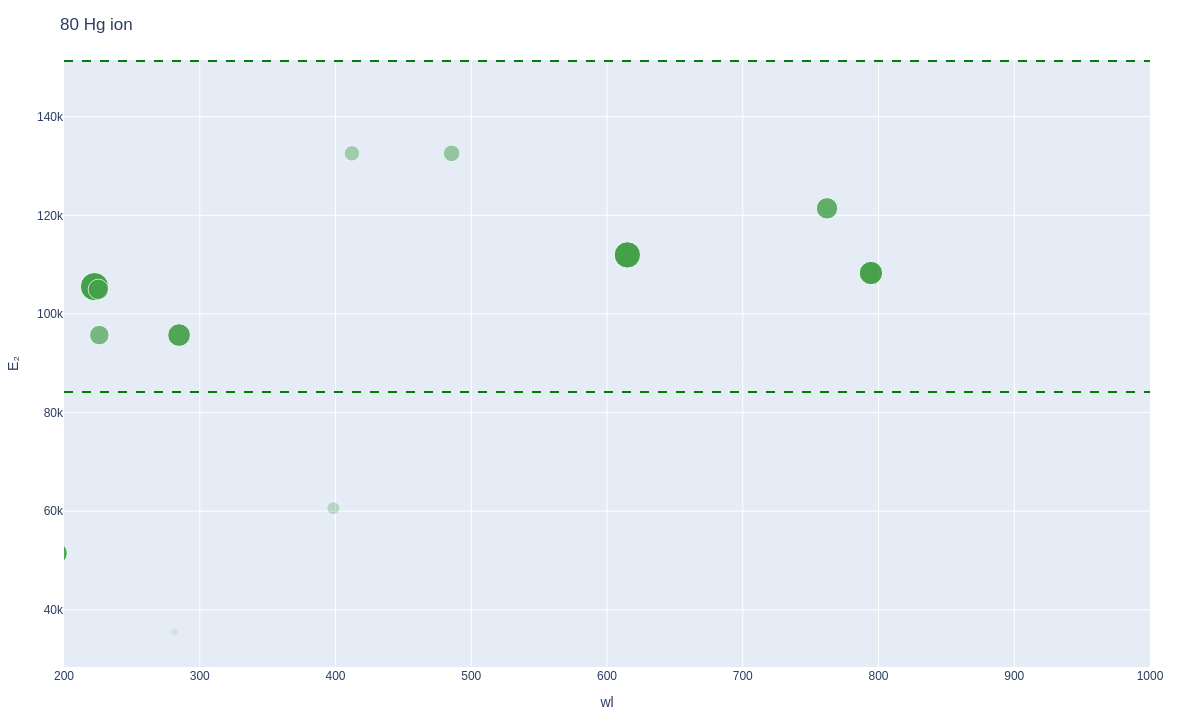
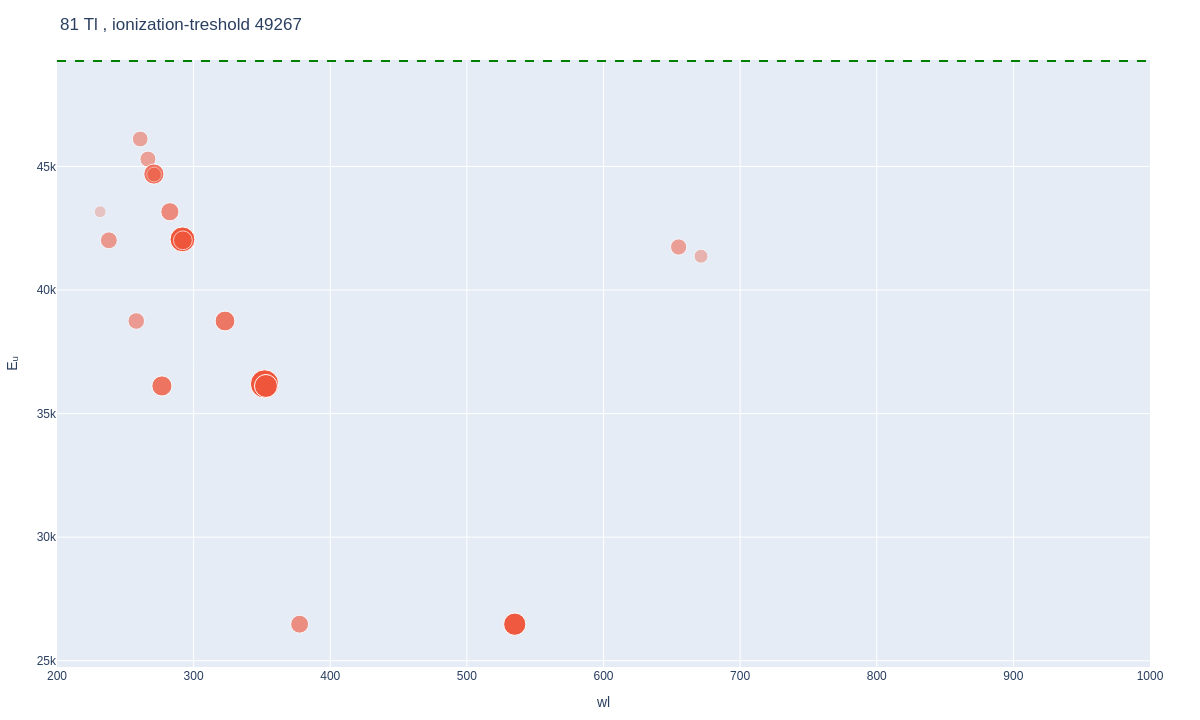
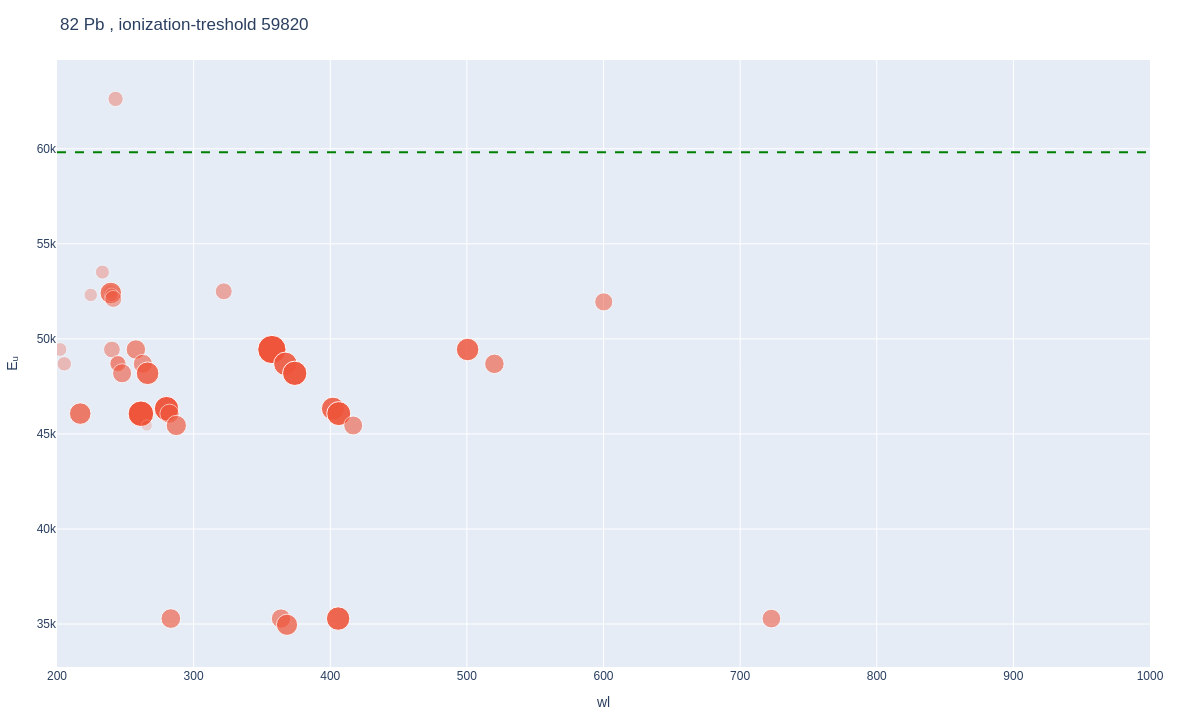
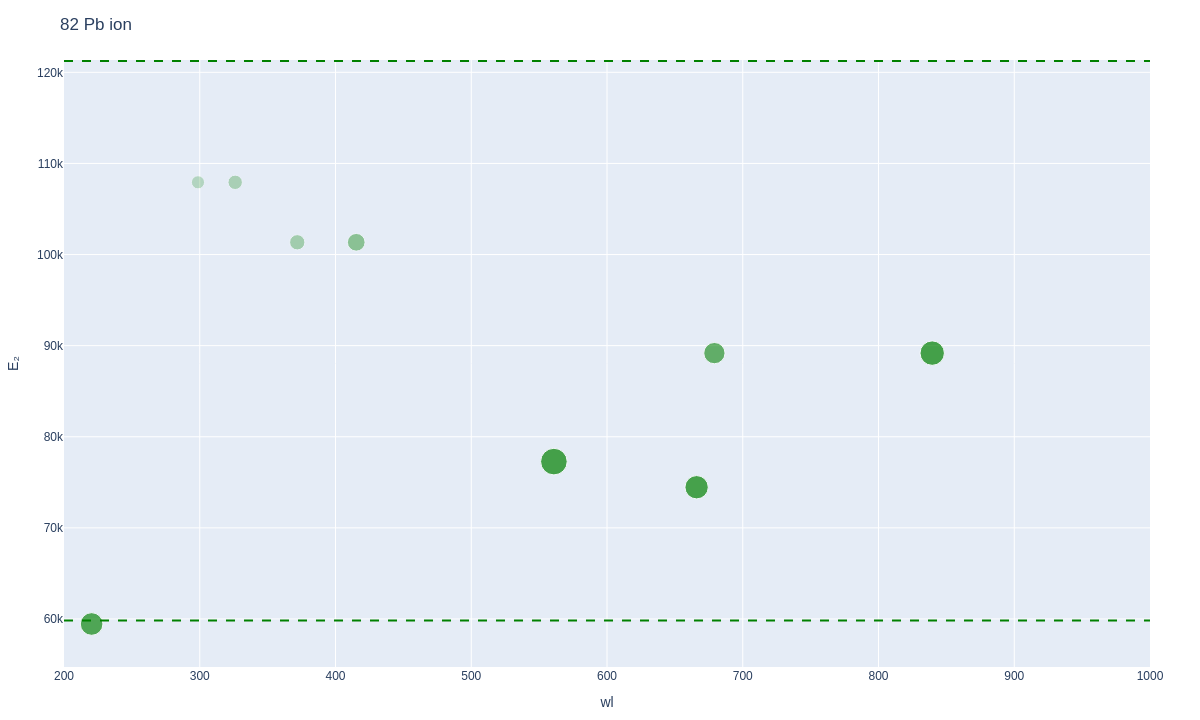
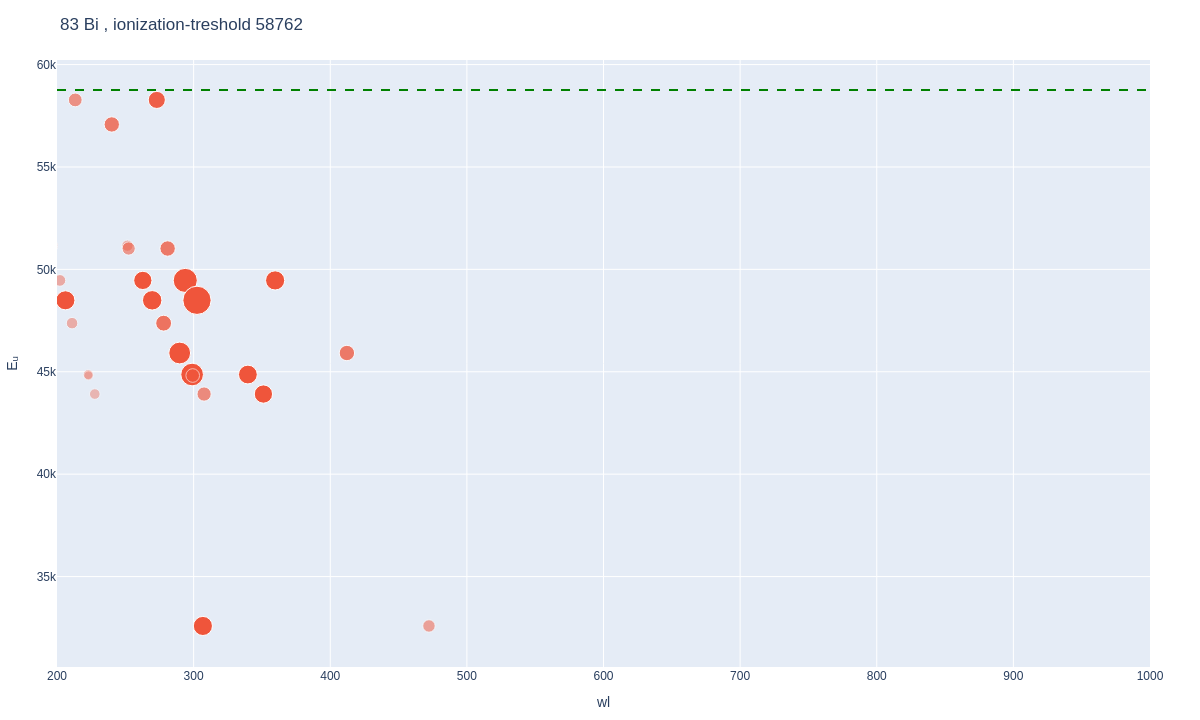
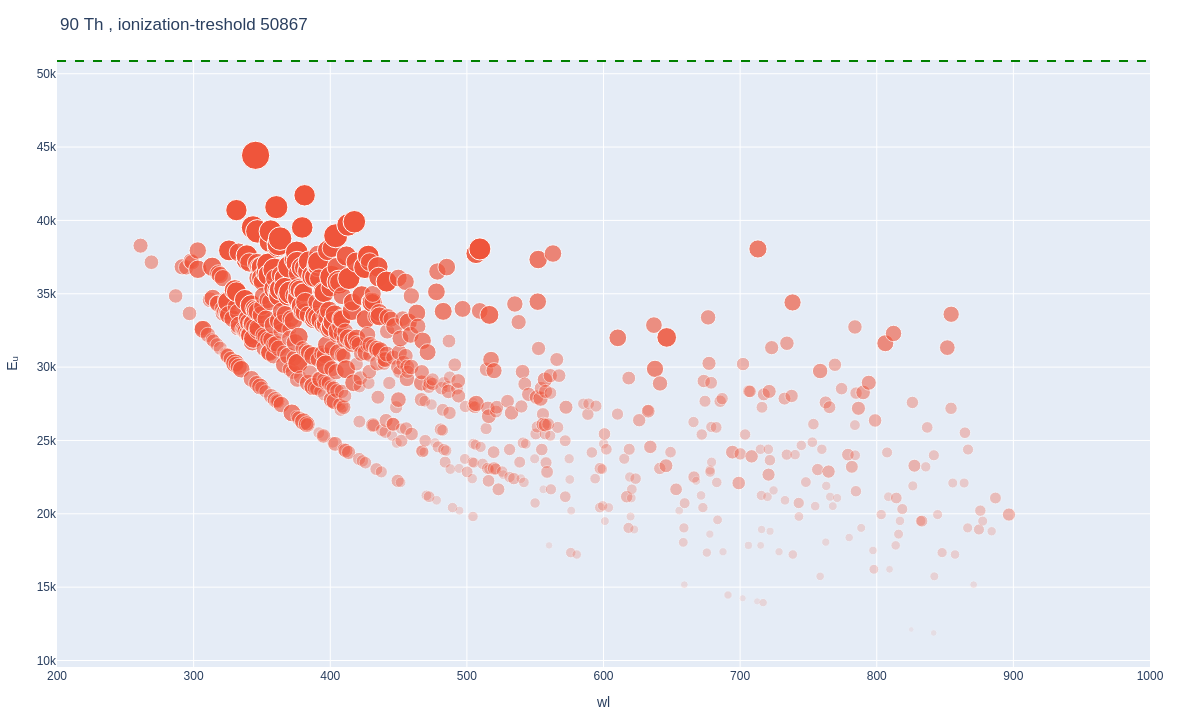
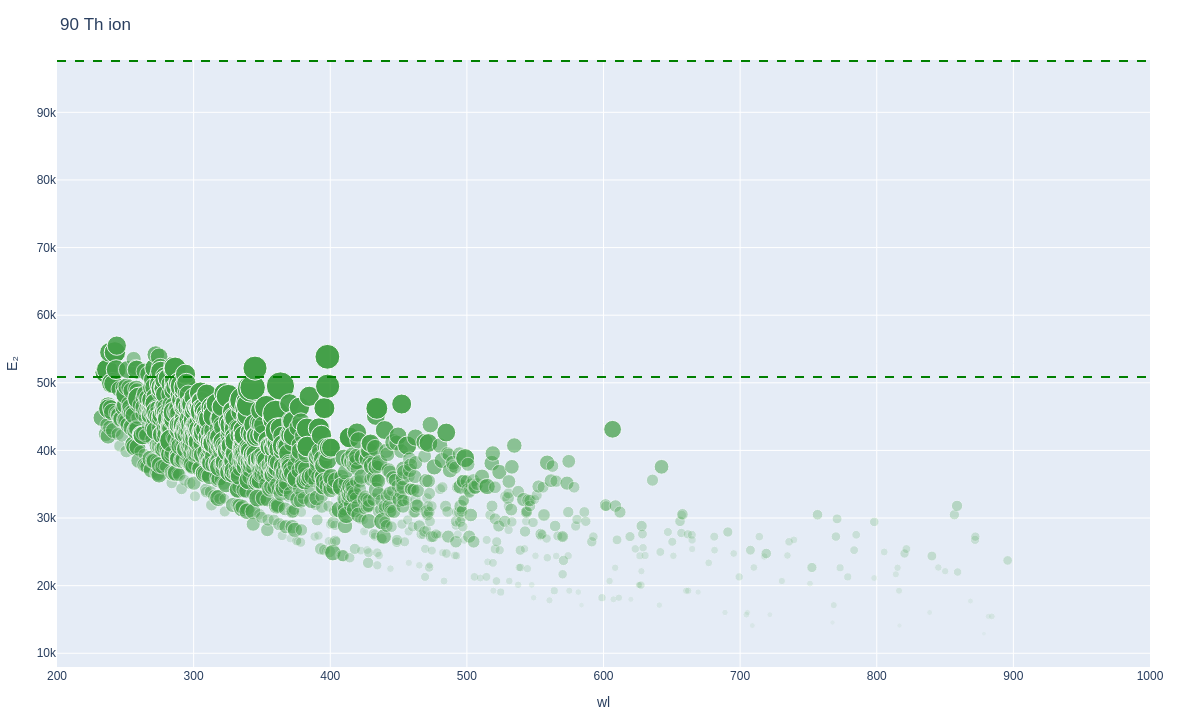
In this section we show atomic line plots for base state and first ion for almost every element up to element number 92 uranium. These are the basis to how to read unknown elemental emission spectra and to build simulated spectra for our elemental analysis by parameter estimation. The principle of these plots is explained in section x.x.x on atomic line plots and code to produce these is in notebook xx. Lines of low upper energy positioned low in the plot and high probability of transition drawn large are those you are most likely to see to in a LIBS spectrum. These are built based on atomic line lists by Kurucz.
Under the atomic line plots we draw(TODO! NOT YET ADDED) two example simulated spectra from each element, so called minimal and maximal spectra. The selected values of temperatures and electron densities to produce the minimal and maximal spectra are selected somewhat arbitrary based on my own comparisons to experimental LIBS spectra so they might not be such a good fit for other LIBS equipment. They are not the objective truth minimal and maximal but a practical tool where minimal spectrum is used to identify element and maximal spectrum is used to identify peaks.
1 H Hydrogen, 2 He Helium, 3 Li Lithium, 4 Be Beryllium, 5 B Boron, 6 C Carbon, 7 N Nitrogen, 8 O Oxygen, 9 F Fluorine, 10 Ne Neon, 11 Na Sodium, 12 Mg Magnesium, 13 Al Aluminium, 14 Si Silicon, 15 P Phosphorus, 16 S Sulphur, 17 Cl Chlorine, 18 Ar Argon, 19 K Potassium, 20 Ca Calcium, 21 Sc Scandium, 22 Ti Titanium, 23 V Vanadium, 24 Cr Chromium, 25 Mn Manganese, 26 Fe Iron, 27 Co Cobalt, 28 Ni Nickel, 29 Cu Copper, 30 Zn Zinc, 31 Ga Gallium, 32 Ge Germanium, 33 As Arsenic, 34 Se Selenium, 35 Br Bromine, 36 Kr Krypton, 37 Rb Rubidium, 38 Sr Strontium, 39 Y Yttrium, 40 Zr Zirconium, 41 Nb Niobium, 42 Mo Molybdenum, 43 Tc Technetium, 44 Ru Ruthenium, 45 Rh Rhodium, 46 Pd Palladium, 47 Ag Silver, 48 Cd Cadmium, 49 In Indium, 50 Sn Tin, 51 Sb Antimony, 52 Te Tellurium, 53 I Iodine, 54 Xe Xenon, 55 Cs Caesium, 56 Ba Barium, 57 La Lanthanum, 58 Ce Cerium, 59 Pr Praseodymium, 60 Nd Neodymium, 61 Pm Promethium, 62 Sm Samarium, 63 Eu Europium, 64 Gd Gadolinium, 65 Tb Terbium, 66 Dy Dysprosium, 67 Ho Holmium, 68 Er Erbium, 69 Tm Thulium, 70 Yb Ytterbium, 71 Lu Lutetium, 72 Hf Hafnium, 73 Ta Tantalum, 74 W Tungsten, 75 Re Rhenium, 76 Os Osmium, 77 Ir Iridium, 78 Pt Platinum, 79 Au Gold, 80 Hg Mercury, 81 Tl Thallium, 82 Pb Lead, 83 Bi Bismuth, 84 Po Polonium, 85 At Astatine, 86 Rn Radon, 87 Fr Francium, 88 Ra Radium, 89 Ac Actinium, 90 Th Thorium, 91 Pa Protactinium, 92 U Uranium
Note: On web click on a spectrum to open an interactive version or to single atomic line plot data!
 ))
))
1 H Hydrogen
2 He Helium
3 Li Lithium
4 Be Beryllium
5 B Boron
6 C Carbon
Note that molecular peaks are not included in this and for Carbon LIBS spectrum the molecular peaks are important and can be dominant. Carbon molecular peaks are explained in chapter xxx.
7 N Nitrogen
8 O Oxygen
9 F Fluorine
10 Ne Neon
11 Na Sodium
12 Mg Magnesium
13 Al Aluminium
14 Si Silicon
15 P Phosphorus
16 S Sulphur
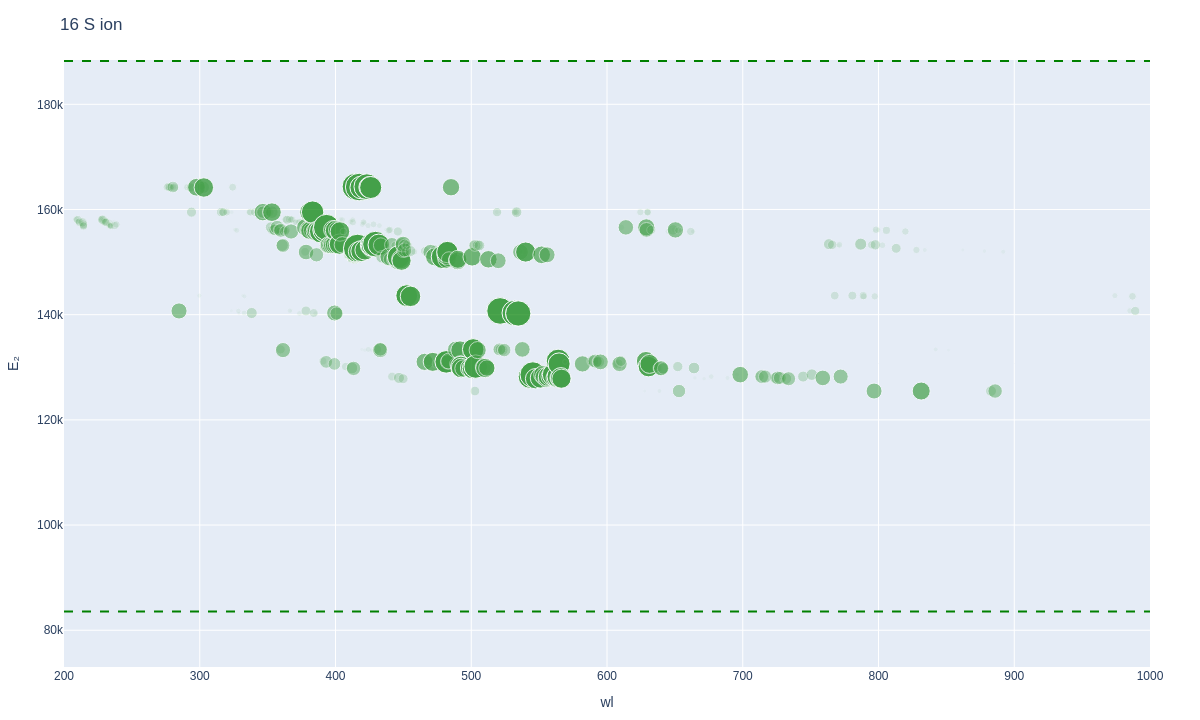
17 Cl Chlorine
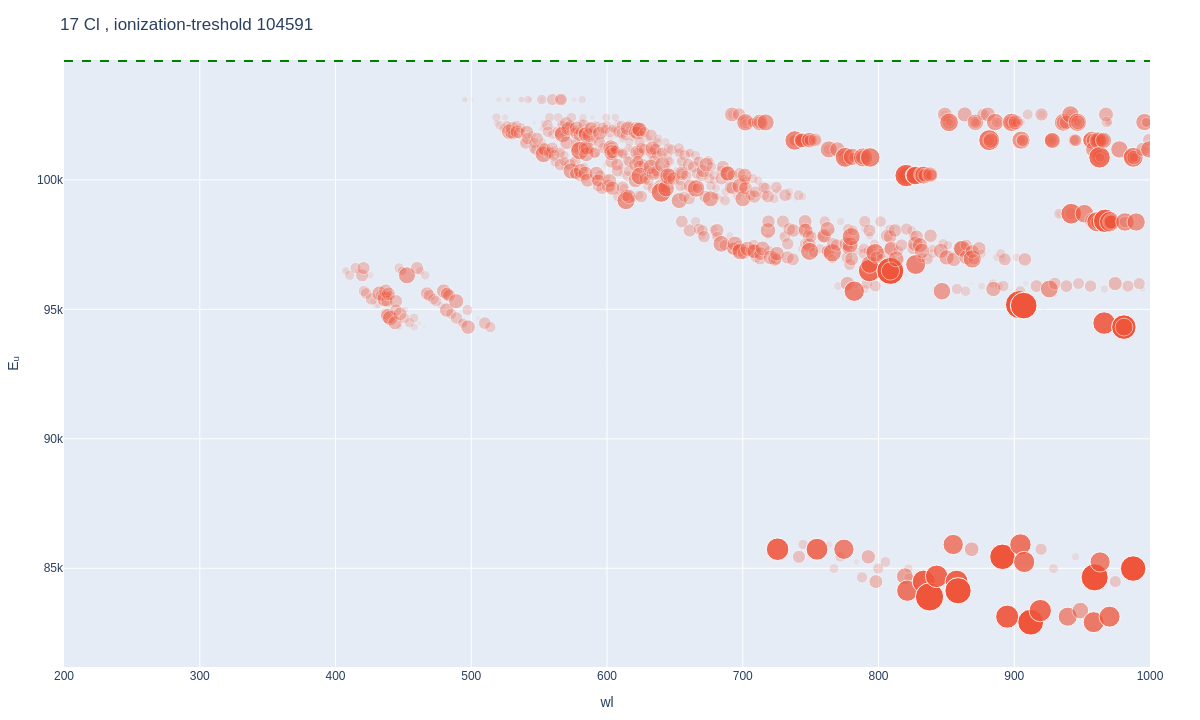
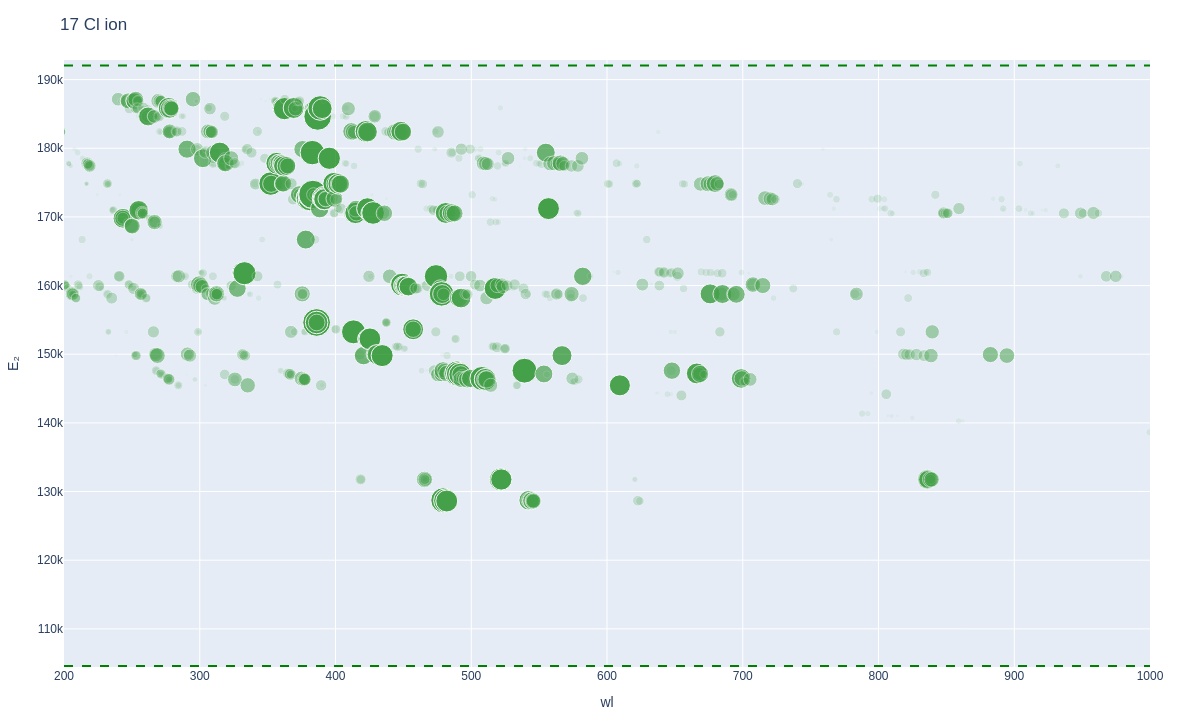
Chlorine lowest excitation energies are quite high at over 80000 eV so they requiring high temperatures to be visible and thus chlorine signal usually quite weak in LIBS.
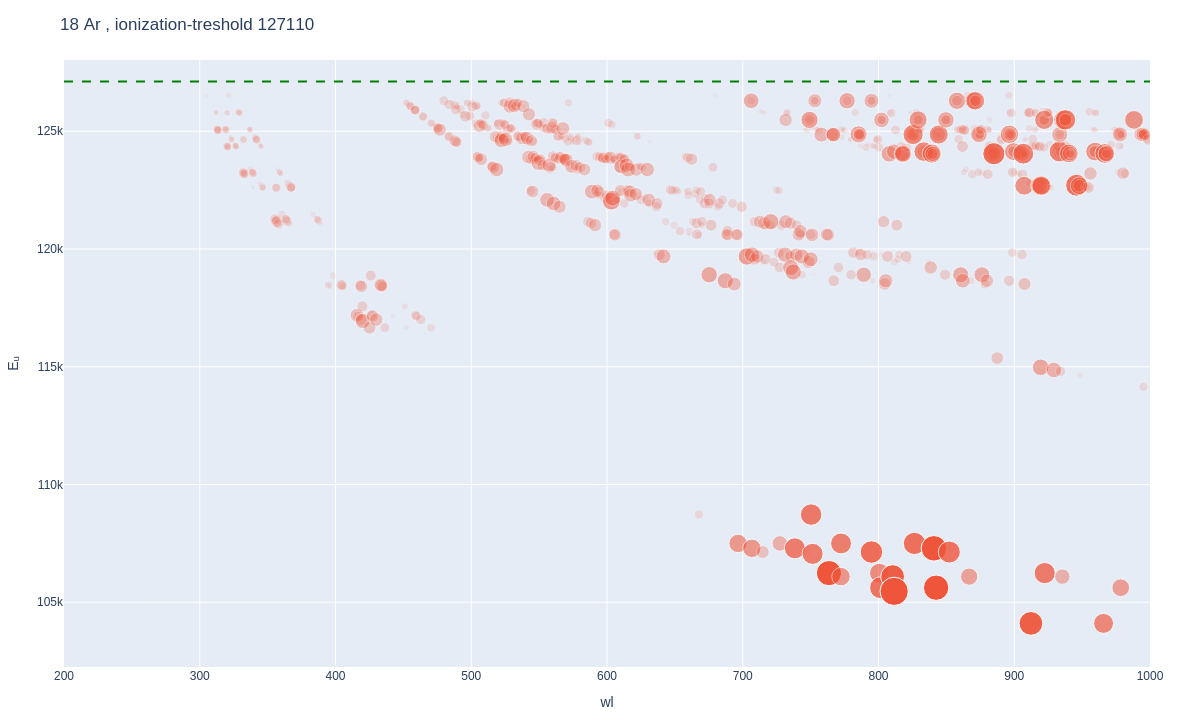
18 Ar Argon
19 K Potassium
20 Ca Calcium
21 Sc Scandium
22 Ti Titanium
23 V Vanadium
24 Cr Chromium
25 Mn Manganese
26 Fe Iron
27 Co Cobalt
28 Ni Nickel
29 Cu Copper
30 Zn Zinc
31 Ga Gallium
32 Ge Germanium
33 As Arsenic

34 Se Selenium

35 Br Bromine


36 Kr Krypton


37 Rb Rubidium

38 Sr Strontium
39 Y Yttrium
40 Zr Zirconium
41 Nb Niobium
42 Mo Molybdenum
43 Tc Technetium


44 Ru Ruthenium
45 Rh Rhodium
46 Pd Palladium
47 Ag Silver
48 Cd Cadmium
49 In Indium
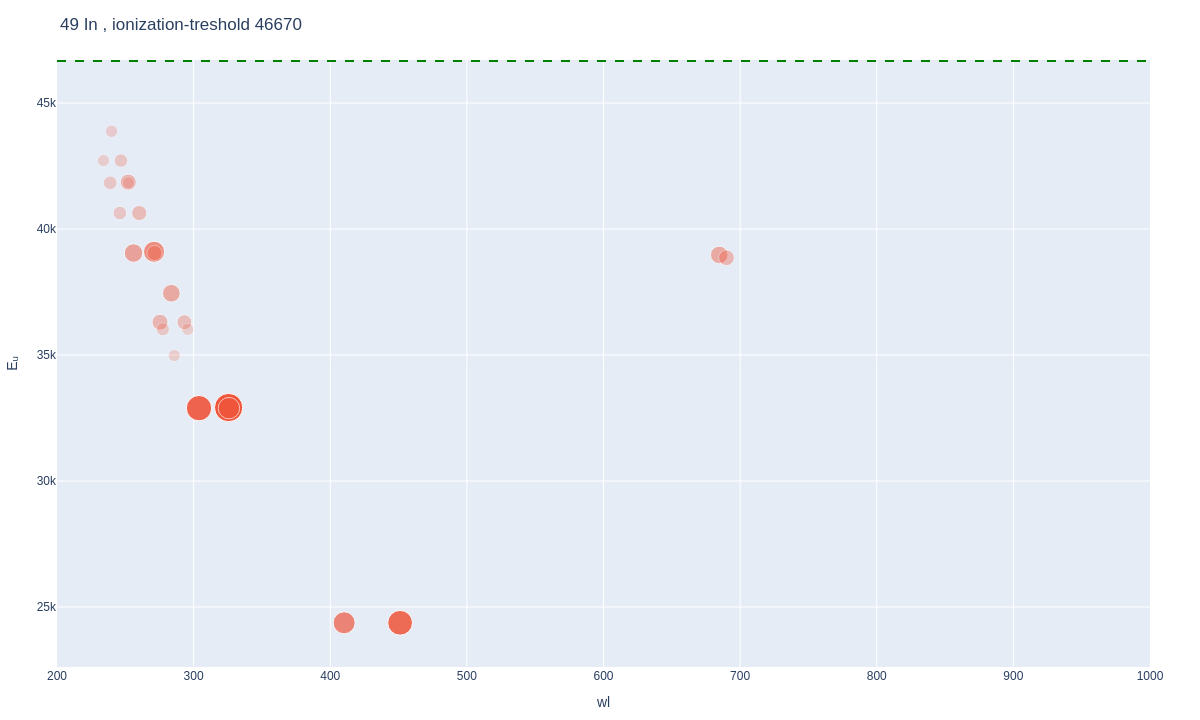
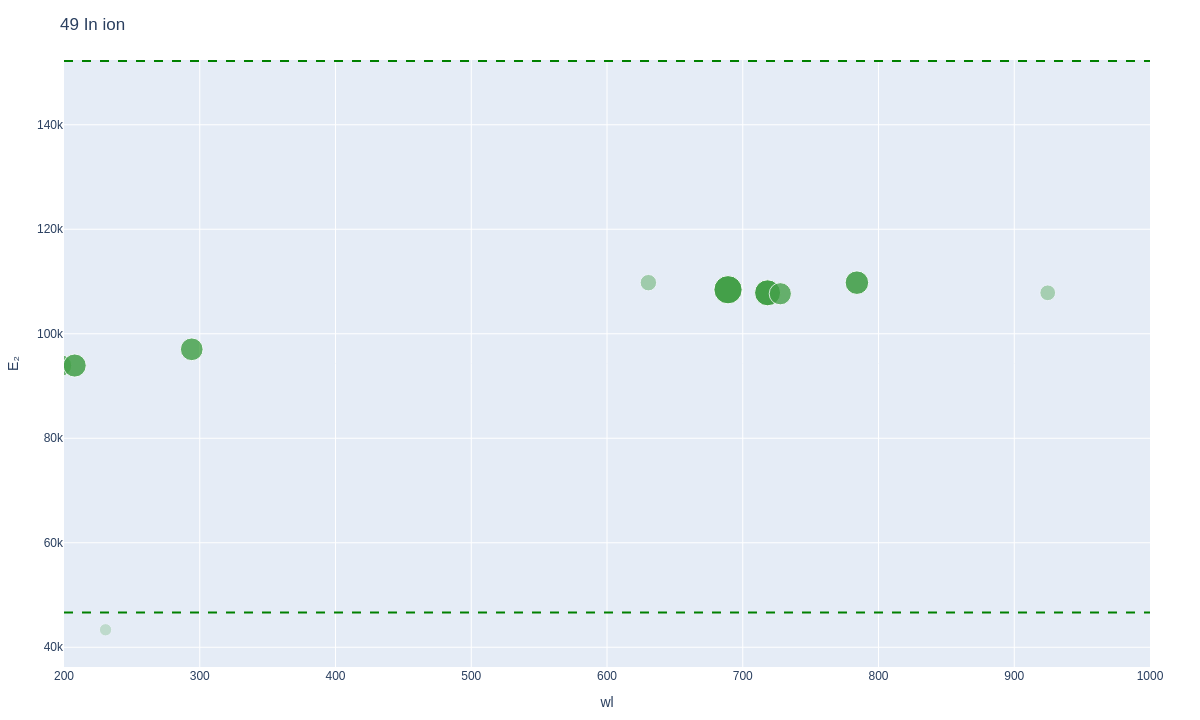
50 Sn Tin
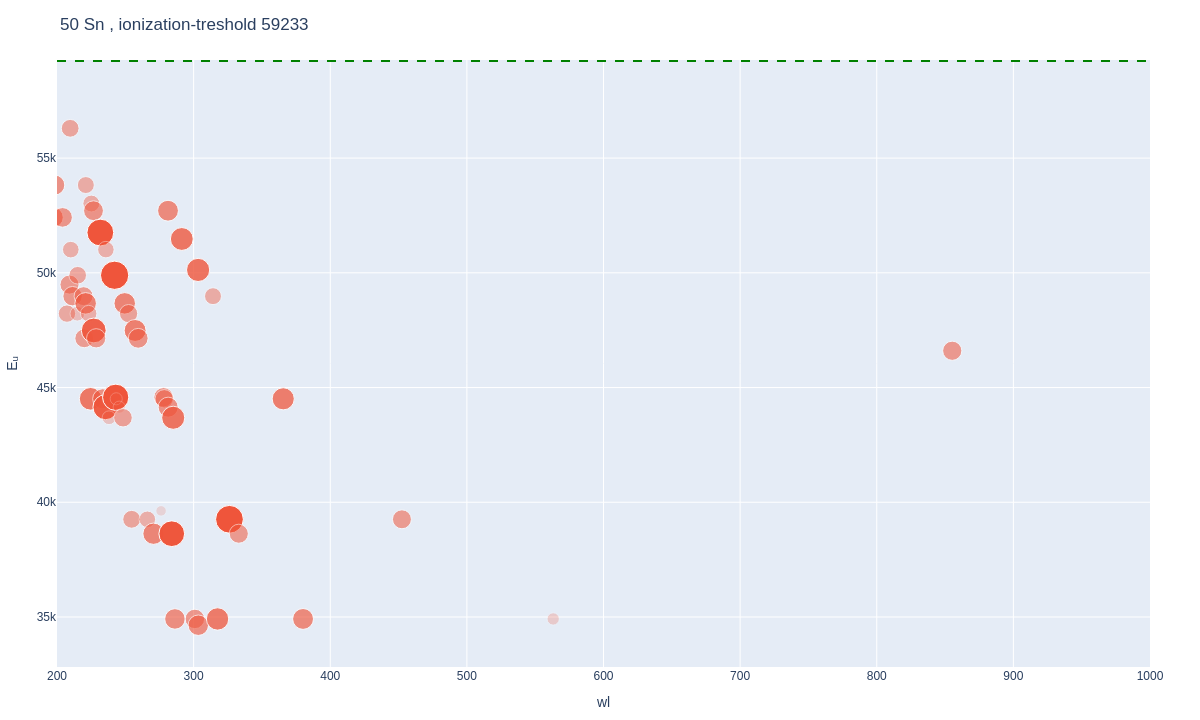
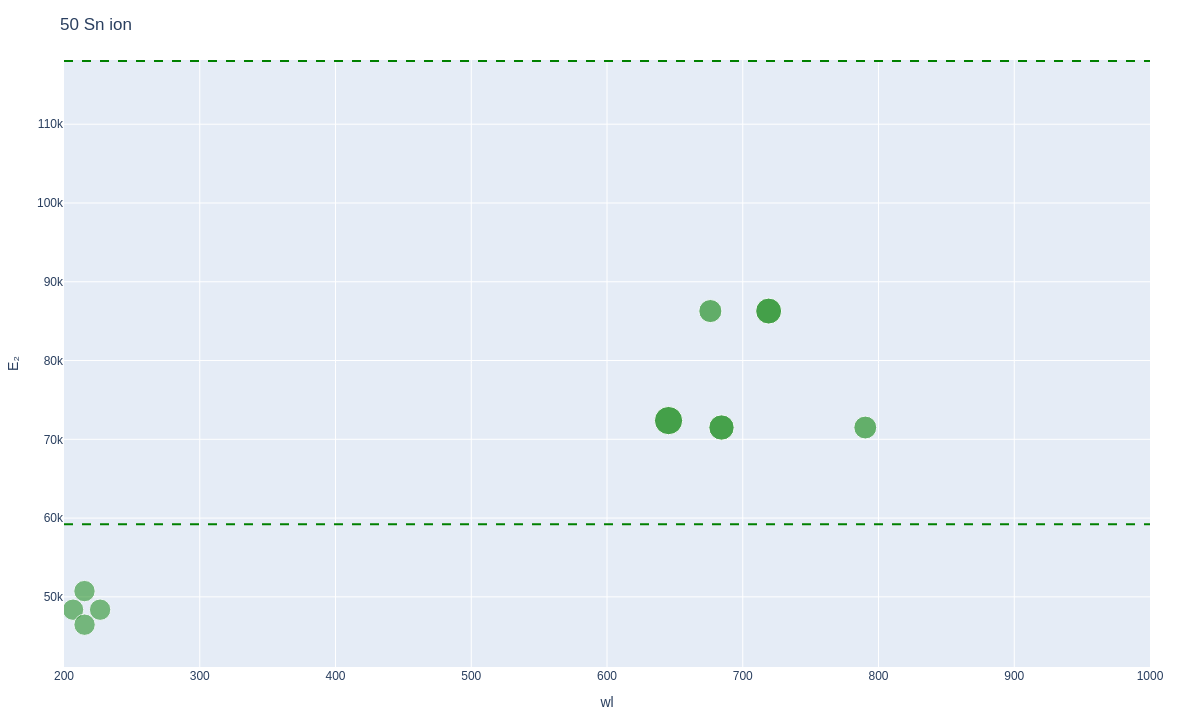
51 Sb Antimony
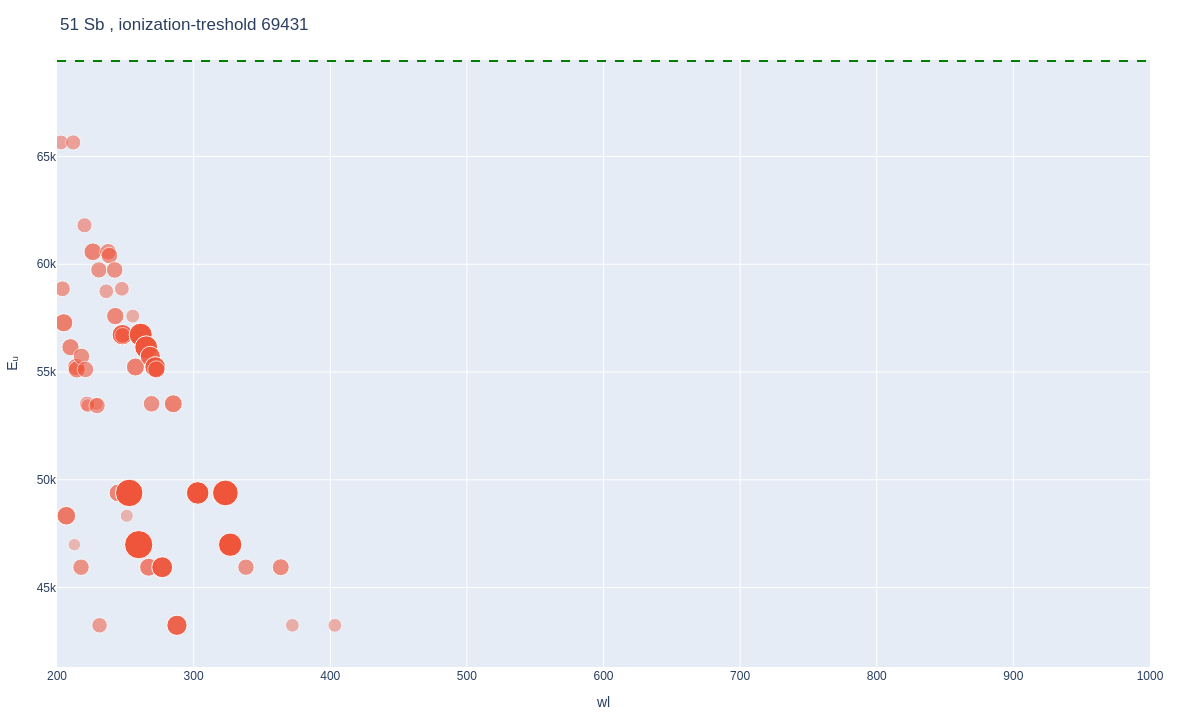

52 Te Tellurium
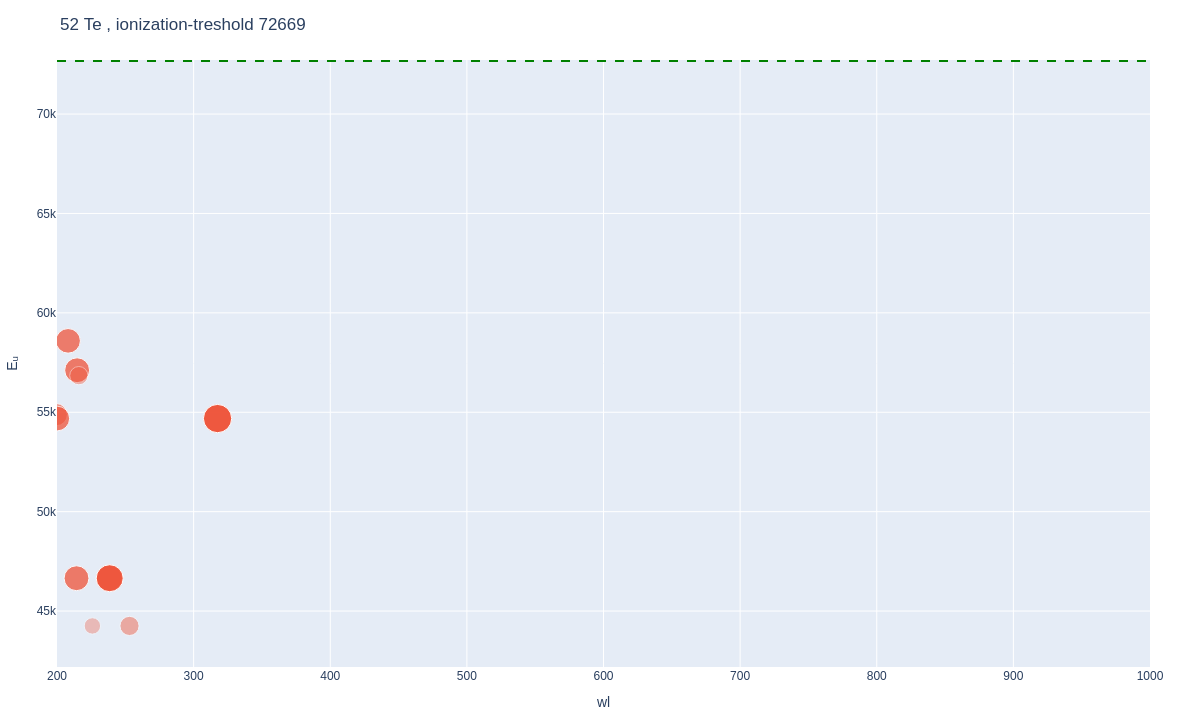

53 I Iodine


54 Xe Xenon


55 Cs Caesium
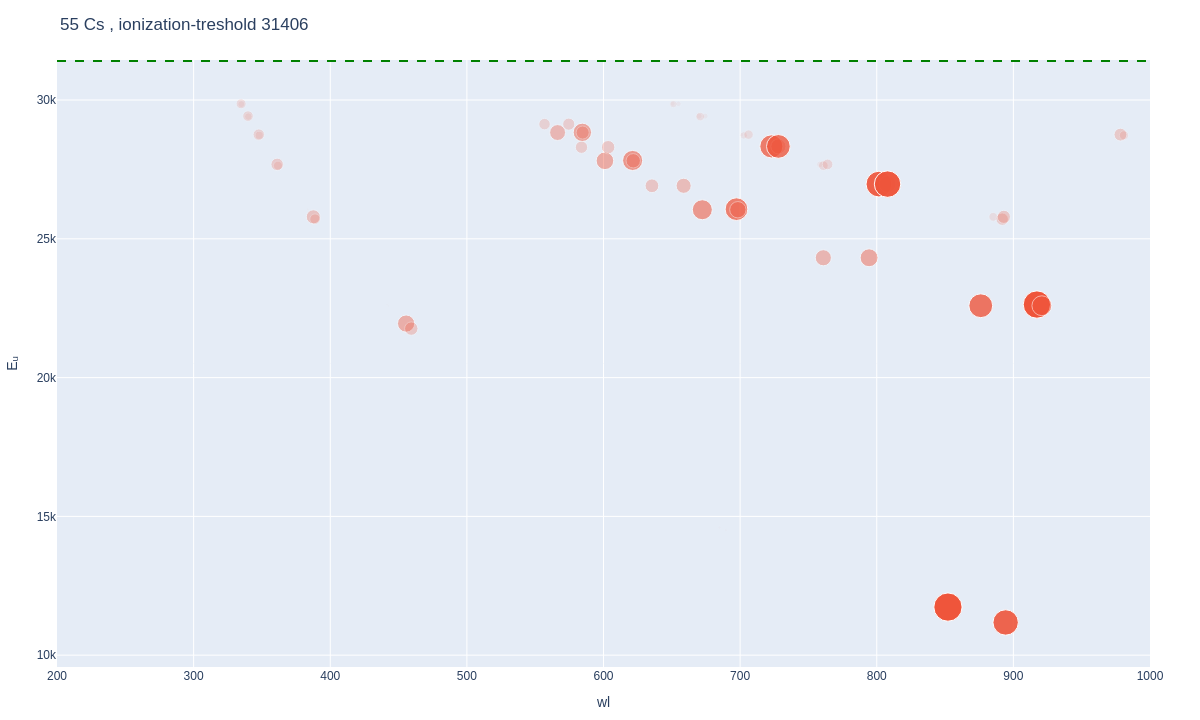

56 Ba Barium
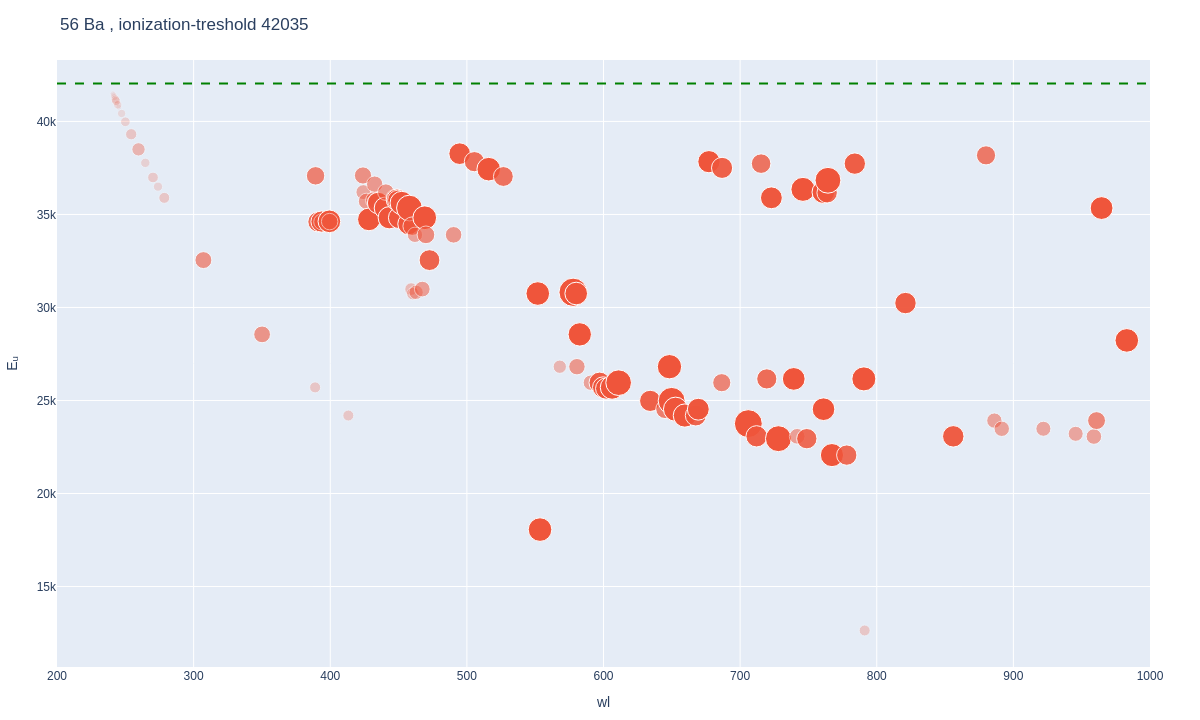
57 La Lanthanum
58 Ce Cerium
59 Pr Praseodymium
60 Nd Neodymium
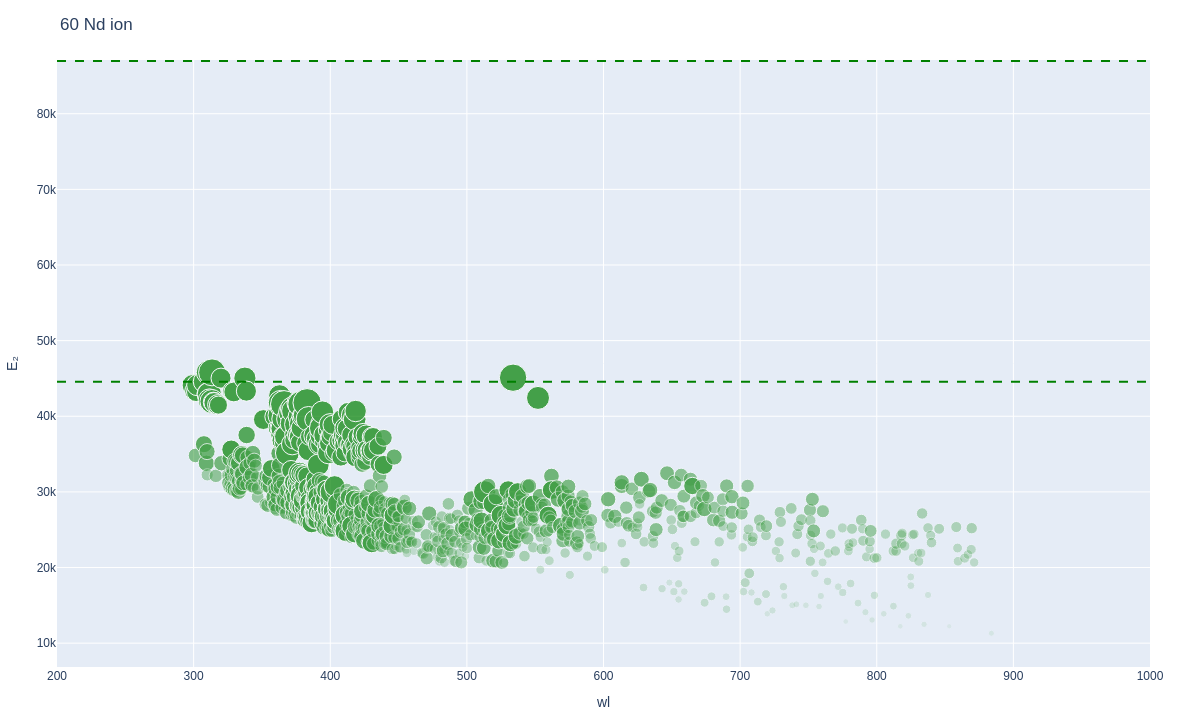
61 Pm Promethium


62 Sm Samarium
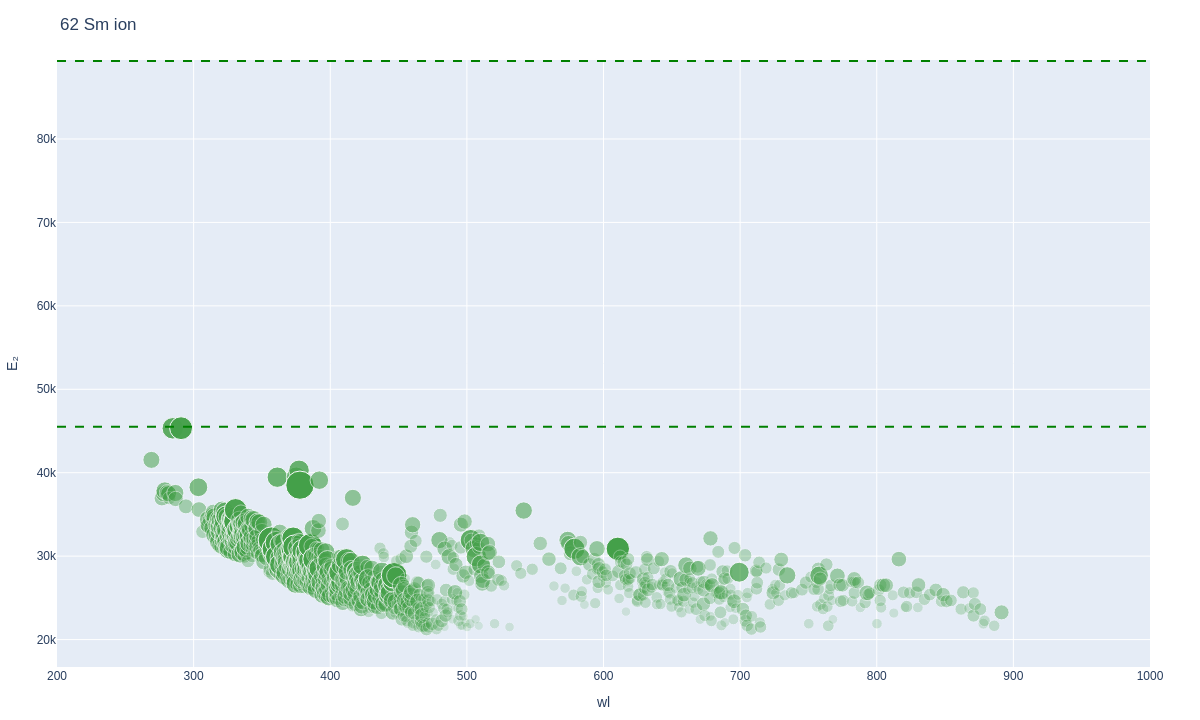
63 Eu Europium
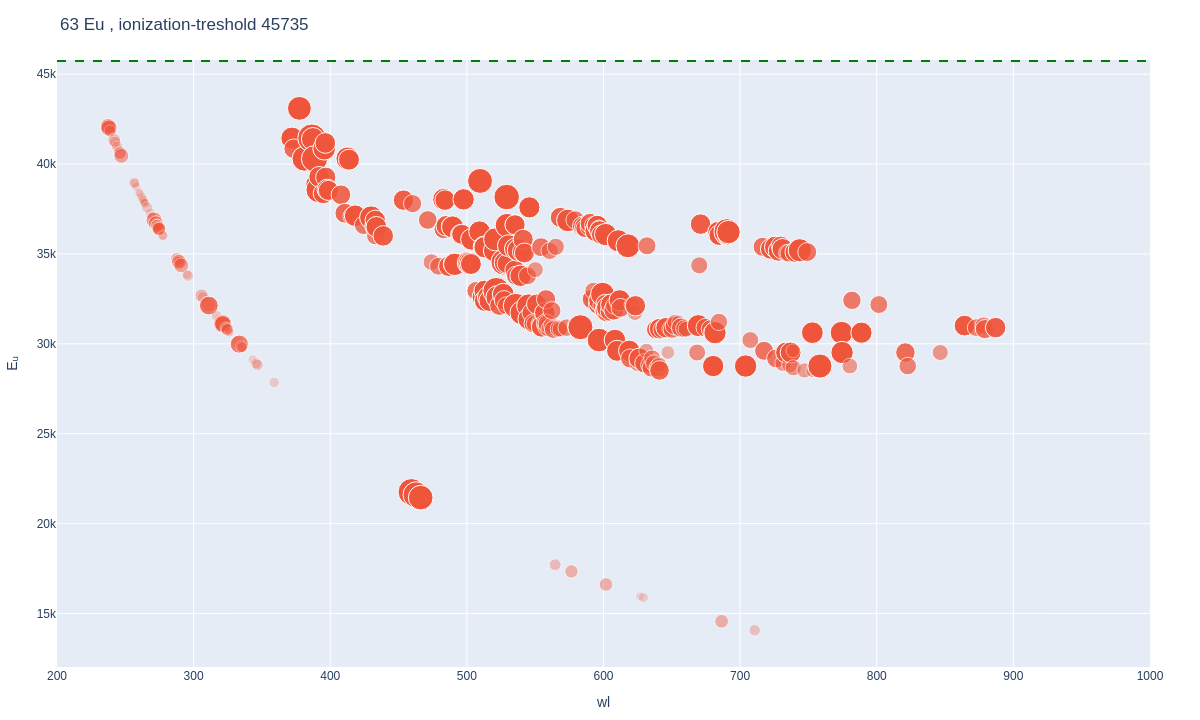
64 Gd Gadolinium
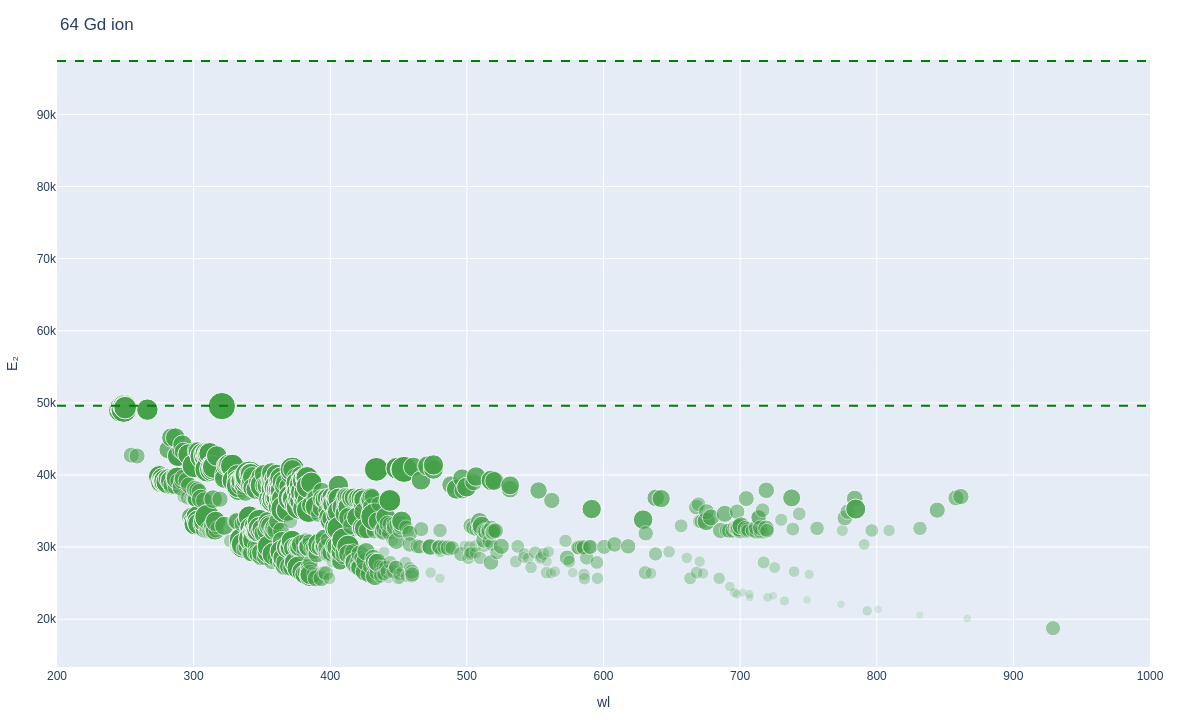
65 Tb Terbium
66 Dy Dysprosium
67 Ho Holmium
68 Er Erbium
69 Tm Thulium
70 Yb Ytterbium
71 Lu Lutetium
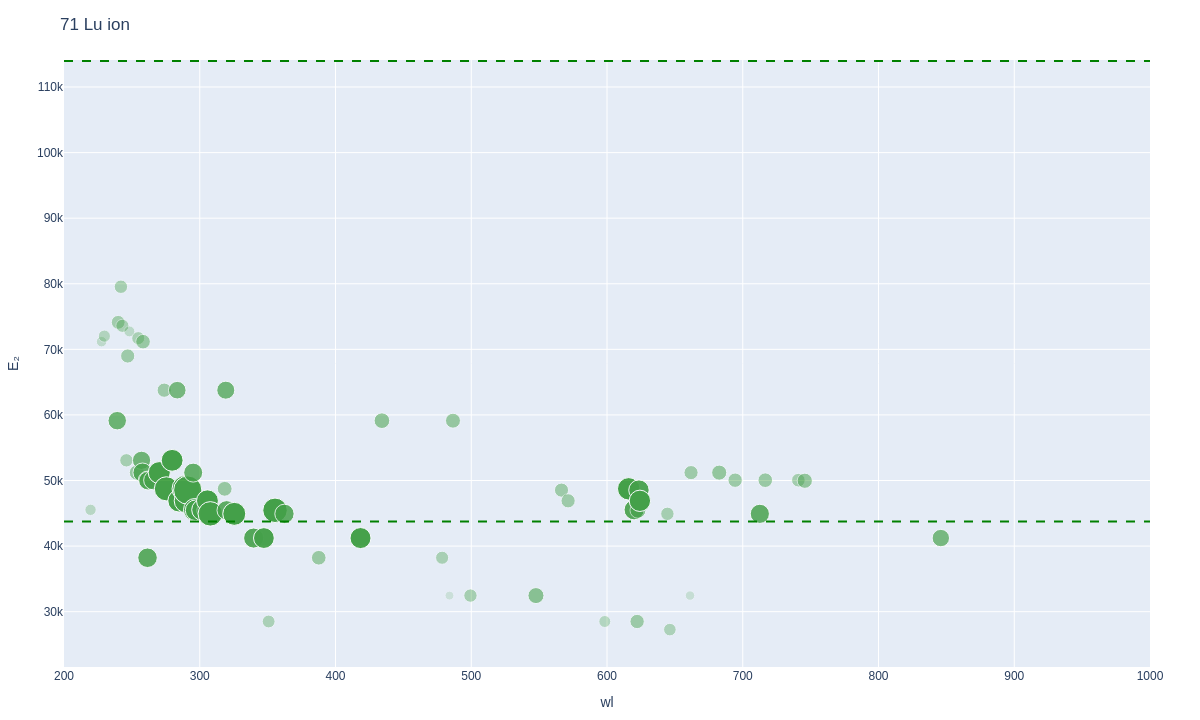
72 Hf Hafnium
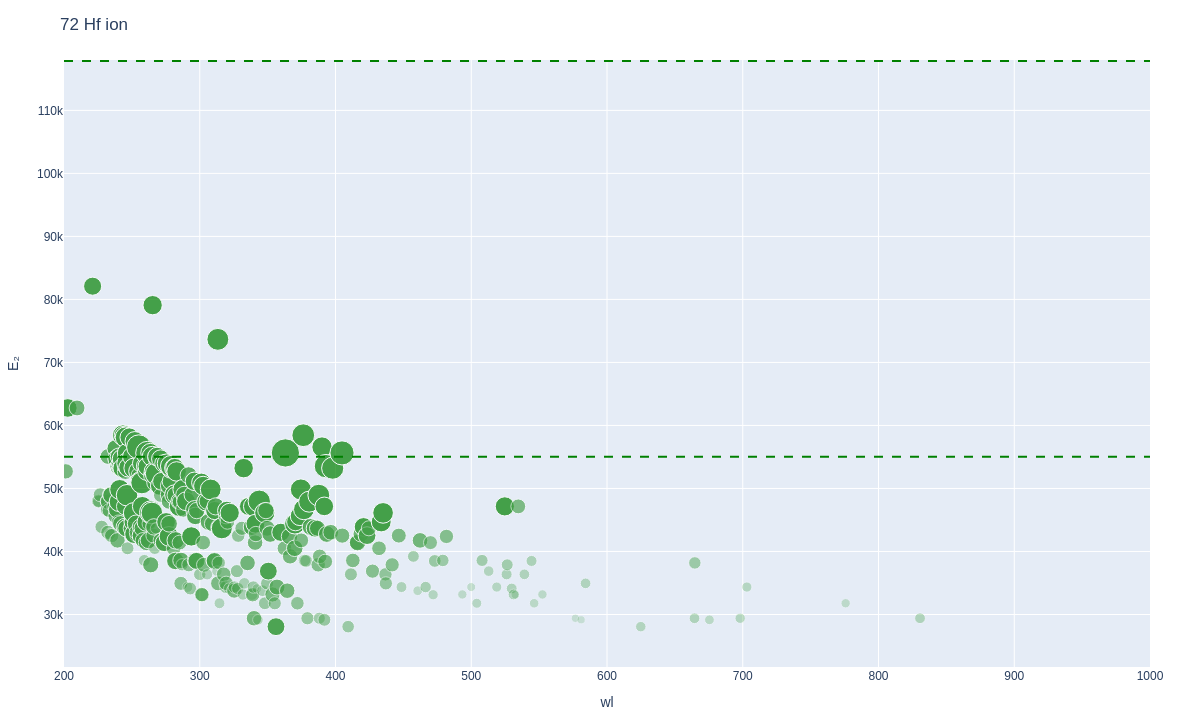
73 Ta Tantalum
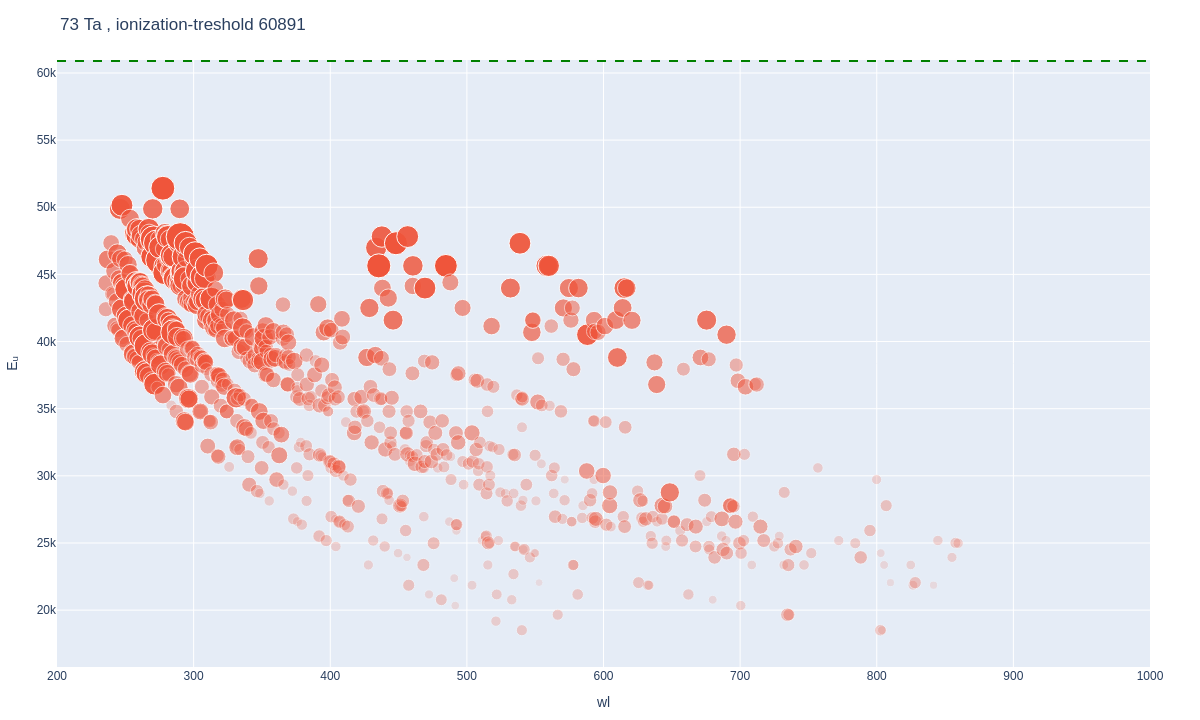
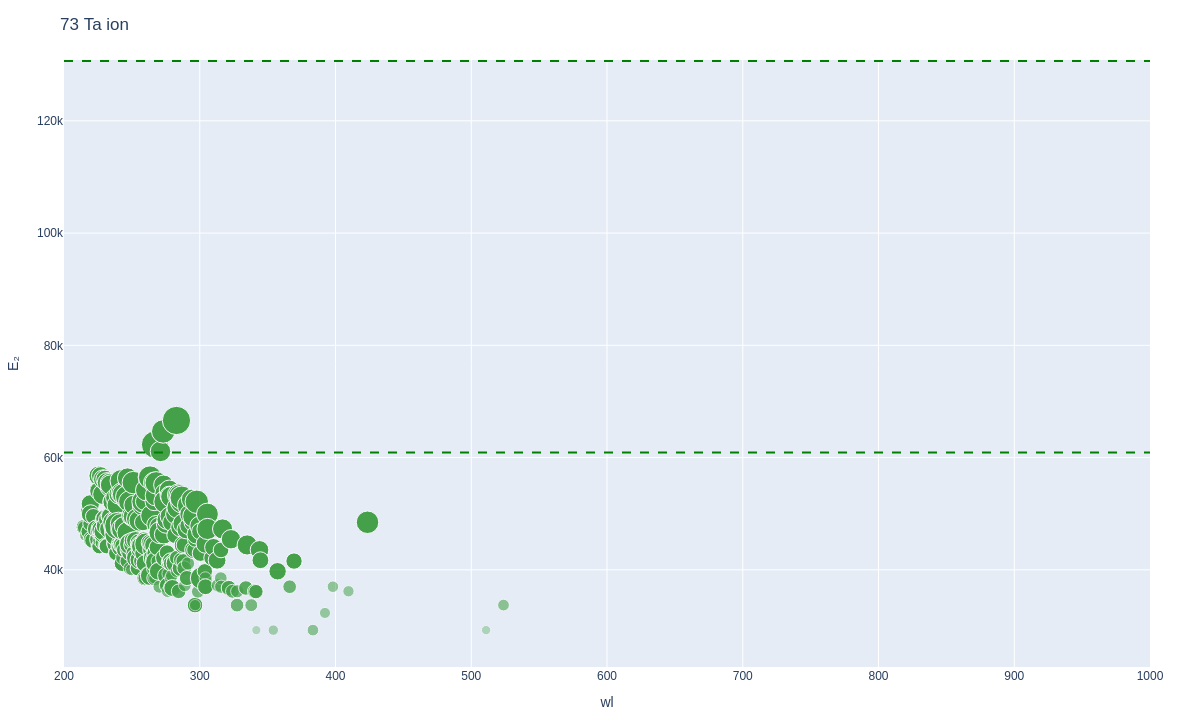
74 W Tungsten
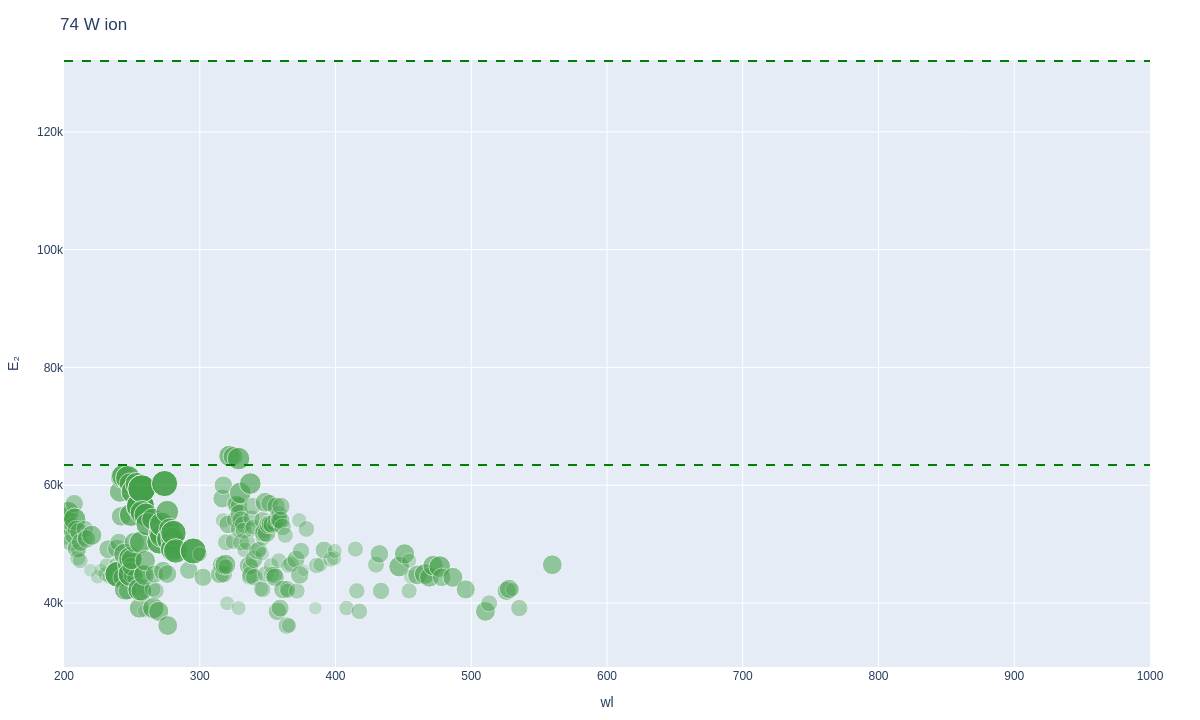
75 Re Rhenium
76 Os Osmium
77 Ir Iridium
78 Pt Platinum

79 Au Gold

80 Hg Mercury
81 Tl Thallium

82 Pb Lead
83 Bi Bismuth

90 Th Thorium
92 U Uranium