Note
Go to the end to download the full example code.
Source-level RSA using a searchlight on volumetric data#
This example demonstrates how to perform representational similarity analysis (RSA) on volumetric source localized MEG data, using a searchlight approach.
In the searchlight approach, representational similarity is computed between the model and searchlight “patches”. A patch is defined by a seed voxel in the source space and all voxels within a given radius. By default, patches are created using each voxel as a seed point, so you can think of it as a “searchlight” that scans through the brain.
The radius of a searchlight can be defined in space, in time, or both. In this example, our searchlight will have a spatial radius of 1 cm. To save computation time, we will only perform the RSA on a single time point, but feel free to experiment with specifying a temporal radius and performing the RSA in time as well.
The dataset will be the MNE-sample dataset: a collection of 288 epochs in which the participant was presented with an auditory beep or visual stimulus to either the left or right ear or visual field.
# sphinx_gallery_thumbnail_number=2

# Import required packages
import mne
import mne_rsa
from nilearn.plotting import plot_stat_map

mne.set_log_level(False)  # Be less verbose
We’ll be using the data from the MNE-sample set.
sample_root = mne.datasets.sample.data_path(verbose=True)
sample_path = sample_root / "MEG" / "sample"
mri_dir = sample_root / "subjects" / "sample"
Creating epochs from the continuous (raw) data. We downsample to 100 Hz to speed up the RSA computations later on.
raw = mne.io.read_raw_fif(sample_path / "sample_audvis_filt-0-40_raw.fif")
events = mne.read_events(sample_path / "sample_audvis_filt-0-40_raw-eve.fif")
event_id = {"audio/left": 1, "audio/right": 2, "visual/left": 3, "visual/right": 4}
epochs = mne.Epochs(raw, events, event_id, preload=True)
It’s important that the model RDM and the epochs are in the same order, so that each row in the model RDM will correspond to an epoch. The model RDM will be easier to interpret visually if the data is ordered such that all epochs belonging to the same experimental condition are right next to each-other, so patterns jump out. This can be achieved by first splitting the epochs by experimental condition and then concatenating them together again.
epoch_splits = [
    epochs[cl] for cl in ["audio/left", "audio/right", "visual/left", "visual/right"]
]
epochs = mne.concatenate_epochs(epoch_splits)
Now that the epochs are in the proper order, we can create a RDM based on the experimental conditions. This type of RDM is referred to as a “sensitivity RDM”. Let’s create a sensitivity RDM that will pick up the left auditory response when RSA-ed against the MEG data. Since we want to capture areas where left beeps generate a large signal, we specify that left beeps should be similar to other left beeps. Since we do not want areas where visual stimuli generate a large signal, we specify that beeps must be different from visual stimuli. Furthermore, since in areas where visual stimuli generate only a small signal, random noise will dominate, we also specify that visual stimuli are different from other visual stimuli. Finally left and right auditory beeps will be somewhat similar.
def sensitivity_metric(event_id_1, event_id_2):
    """Determine similarity between two epochs, given their event ids."""
    if event_id_1 == 1 and event_id_2 == 1:
        return 0  # Completely similar
    if event_id_1 == 2 and event_id_2 == 2:
        return 0.5  # Somewhat similar
    elif event_id_1 == 1 and event_id_2 == 2:
        return 0.5  # Somewhat similar
    elif event_id_1 == 2 and event_id_1 == 1:
        return 0.5  # Somewhat similar
    else:
        return 1  # Not similar at all


model_rdm = mne_rsa.compute_rdm(epochs.events[:, 2], metric=sensitivity_metric)
mne_rsa.plot_rdms(model_rdm, title="Model RDM")
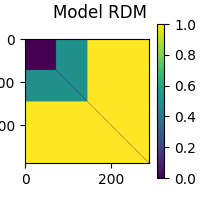
<Figure size 200x200 with 2 Axes>
This example is going to be on source-level, so let’s load the inverse operator and apply it to obtain a volumetric source estimate for each epoch.
inv = mne.minimum_norm.read_inverse_operator(
    sample_path / "sample_audvis-meg-vol-7-meg-inv.fif"
)
epochs_stc = mne.minimum_norm.apply_inverse_epochs(epochs, inv, lambda2=0.1111)
Performing the RSA. This will take some time. Consider increasing n_jobs to
parallelize the computation across multiple CPUs.
rsa_vals = mne_rsa.rsa_stcs(
    epochs_stc,  # The source localized epochs
    model_rdm,  # The model RDM we constructed above
    src=inv["src"],  # The inverse operator has our source space
    stc_rdm_metric="correlation",  # Metric to compute the MEG RDMs
    rsa_metric="kendall-tau-a",  # Metric to compare model and EEG RDMs
    spatial_radius=0.01,  # Spatial radius of the searchlight patch
    temporal_radius=None,  # Don't perform search light over time
    tmin=0.09,
    tmax=0.11,  # Time interval to analyze
    n_jobs=1,  # Only use one CPU core. Increase this for more speed.
    verbose=False,
)  # Set to True to display a progress bar
Here is how to plot the result using nilearn.
img = rsa_vals.as_volume(inv["src"], mri_resolution=False)
t1_fname = mri_dir / "mri" / "T1.mgz"
plot_stat_map(img, t1_fname, threshold=0.1)
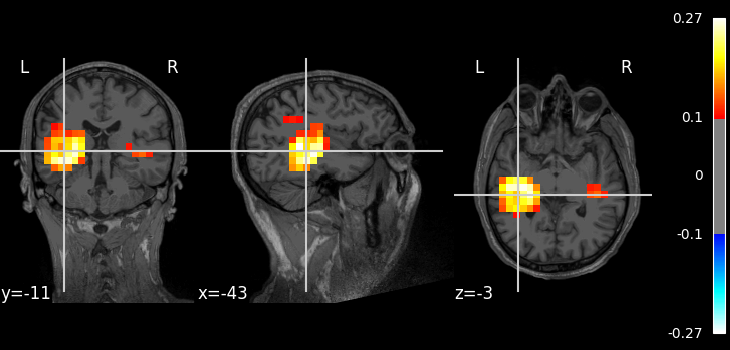
<nilearn.plotting.displays._slicers.OrthoSlicer object at 0x0000023392342F60>
Total running time of the script: (0 minutes 38.803 seconds)