Scroll tracking
ilkka.j.leppanen@aalto.fi | Back to main
This page describes the scroll-tracking method. It is recommended reading for anyone interested in using the method, although one needs knowledge of the oTree platform to program a scroll tracking application.
Scroll tracking is a process-tracing method that can be used to study the latent human computational process behind the comparison and integration of subjective decision values. The method follows how decision makers interact with responsive elements in a mobile web environment using touch-scroll gestures.
Scroll tracking means recording how the user interacts with scrollable elements in a browser-based mobile app. The app, described below, records the movement of a scroll bar and uses this information to index attention and dynamic preference formation.
Source code and demo
The demo contains a generic setting with two options, which can be used as a template to build a custom scroll-tracking setup. For example, you can add stimuli and randomisation using the logic in which oTree apps are built. It is recommended that HTML elements and attributes are dynamically changed via JavaScript (see bottom of this page).
The app works best in relatively new devices. A desktop browser can be used for testing in responsive design mode. Minimum screen width is 300 px which is less than any modern smart device.
The oTree environment
The app is developed in oTree Studio. The main back end is built with Python and the browser functionalities with HTML5, CSS and JavaScript.
On each round the user is presented with two choices that are embedded in a scrollable div-element. The user scrolls between the options to acquire visual information on them.
Which data does the app record?
The app records choices (player.choice as an oTree field variable) and response curves. Choices are binary (e.g. option 1 and option 2) and response curves are recordings of horizontal scrollbar positions and time stamps.
Recording the response curve is executed with JavaScript. The x-component of the response curve is based on the DOM Element scrollLeft, while the y-component is based on time keeping, the JS Date() function (Unix time in milliseconds since the epoch). See below for an illustration of the response curve.
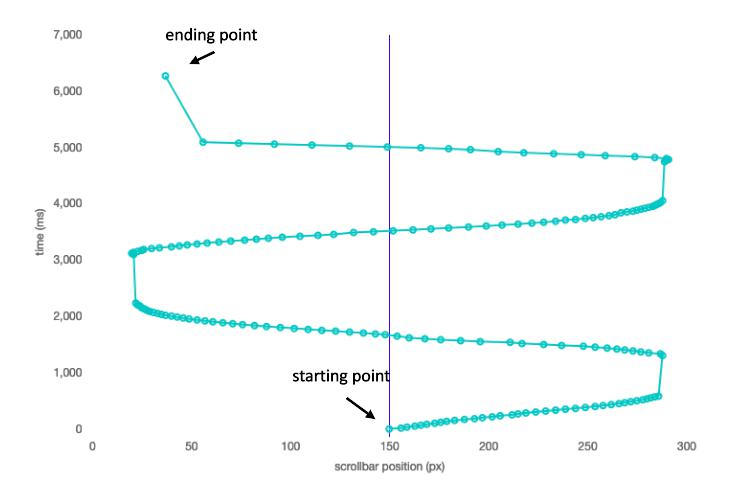
- Scrollbar positions (x-coordinates): the app detects whenever the scrollable container (div-element) containing the stimuli is moved and adds the position to a string vector. All x-positions of the scroll bar during each decision round are contained in variable
player.x. - Time stamps (y-coordinates): the app records a time stamp whenever the scrollbar is moved, and adds these to a string vector, contained in variable
player.y. When the x and y positions are known, the response curve can be constructed. - Good to know: overscrolling: Safari, which is used in most iPhones, responds to overscrolling by updating scrollLeft beyond the maximum scroll position, while Chrome and Firefox (used in most other platforms) do not. In the current app the overscroll property is not disabled, therefore there is a "bounce" when the stimuli container is scrolled to extreme left or right.
The response metrics of dwell times are in variables player.dwelltimeL and player.dwelltimeR for left, right side dwell times, both expressed in seconds. The polygon areas are in variables player.psiL and player.psiR, correspondingly.
The app records switches (player.switchesLR for left-to-right and player.switchesRL for right-to-left). Switches count how many times a user has made a left-to-right or right-to-left switch. These measures are recoverable from the response curve in offline analysis, and the response curve can be used to analyse, for example, at which time points a switch has occurred or how long the individual dwells were.
The app also records scroll times (player.scrolltime) and decision times (player.dectime), where the former indicates time spent scrolling the options and the latter the total time of scrolling + response time to click the button. Response curve y-axes (Unix time stamps) are expressed in milliseconds but scroll times and decision times are expressed in seconds. The variable player.dectime should be understood as the response time of decision making.
The total distance travelled by the scroll bar is given in player.xdist, measured in pixels. The last dwell position is given in an indicator variable player.lastdwell.
Resolution and number precision
Samples are recorded only when the scroll bar is moving, this means that the sampling frequency is "endogenous" and variable. In previous usage of the app it has been observed that it records on average about 30-35 datapoints per second but this figure should not be compared to psychophysiological equipment such as eye-trackers that sample at a constant rate.
There are usually 1-5 additional datapoints in player.x than in player.y; this discrepancy is resolved by removing the first datapoints from the x-variable when the other metrics are calculated from the response curve.
In some modern browsers the Element scrollLeft property is "sub-pixel precise" meaning that scroll bar movements (x direction) might not be in whole numbers.
Offline analysis
The study data includes the x and y coordinates for the response curve (player.x, player.y), for each round as a string variable, and a Python script can be used to analyse these curves, e.g. by first parsing the x and y values from these strings and then combining them as a NumPy array. As noted above, the x variable has more datapoints and it should be shortened from the left to match the length of the y variable.
Vertical scrolling and trinary options
There is a development version where the stimuli move up and down and the user scrolls vertically, and a version with three options. The principles of response curve formation and analysis are similar as in the version described here.
What kind of stimuli can be used?
The method has been tested with simple pictorial stimuli (consumer products) and with graphical depiction of uncertainty (lotteries).
JavaScript combined with HTML and CSS makes a flexible framework and it can be used, for example, to dynamically change graphical elements and attributes in the stimuli from round to another (see Javascript HTML DOM and oTree docs).
Updated 20/11/2025