|
Changes.log
06/Mar/2014
Added a demo on how to compare inter-subject similarity of BOLD time series with inter-subject similarity of behavioural data |
Permutation tests
A collection of scripts used in ongoing project and past published papersPlease contact me at enrico.glerean _at_ aalto.fi to suggest improvements, changes, comments etc. If you find this code useful for your scientific works, please just acknowledge me.
Comparing two similarity (or dissimilarity/distance) matrices using mantel test
Similarity matrices are symmetrical matrices where each element in the matrix denotes the amount of similarity between two pairs. For example we could have N time series stored in MATLAB in a variable 'timeSeries'. Then the simlarity matrix obtained for them is just
	>> timeSeries = randn(200,10);
	>> simMat = corr(timeSeries);
For example the similarity matrix could be an intersubject correlation matrix or a matrix from representational similarity analysis. The most symple test to assess the statistical significance between a pair of simliarity matrices is the Mantel test. The following function performs a Mantel test between two similarity matrices and computes the p value using permutation tests. I recommend the use of spearman correlation instead of pearson as a metric for comparing the two matrices. The test also works for distance matrices (in this case they have to have zeros on the main diagonal and all positive values, usually what you get out of the pdist command in matlab).
Code:
bramila_mantel.m (12.09.2013)
If you find this function useful, please cite:
Glerean, E., Pan, R.K., Salmi, J., Kujala, R., Lahnakoski, J.M., Roine, U., Nummenmaa, L., Leppämäki, S., Nieminen-von Wendt, T., Tani, P., Saramäki, J., Sams, M., Jääskeläinen, I.P. (in press) Reorganization of functionally connected brain subnetworks in high-functioning autism Human Brain Mapping. doi:10.1002/hbm.23084
From the function help:
    % [out pval]=bramila_mantel(matrix1,matrix2,iter,type)
    %
    % Mantel test for (dis)similarity matrices. The matrices must be squared, of same size,
    % symmetrical and with ones in the main diagonal for the similarity case or zeros in the
    % main diagonal for the distance (dissimilarity) matrix case. If distance matrix, then all
    % values should be positive.
    % Mantel test is performed by correlating the top triangle between the two matrices.
    % P value is obtained with permutations.
    % Input parameter "type" can only be 'pearson' or 'spearman'
    %
    % e.g.:
    %   a = corr(randn(100,10));
    %   b = corr(randn(100,10));
    %   [out pval] = bramila_mantel(a,b,5000,'separman')
    %
    % (c) Enrico Glerean 2013 - Brain and Mind Laboratory Aalto University http://becs.aalto.fi/bml/
Comparing voxelwise inter-subject correlation matrices with intersubject behavioural data
In the paper Nummenmaa et al 2012, PNAS we introduced a novel way to look at inter-subject correlation data by using the mantel test, in a similar fashion than the Representation Similarity Analysis (RSA) does. In RSA the similarity of the BOLD response between conditions is compared with the similarity of the category of conditions. In our approach - for a single voxel - the similarity of BOLD time series between a pair of subjects is compared to the similarity between their behavioural data (the model matrix). To illustrate this with a picture: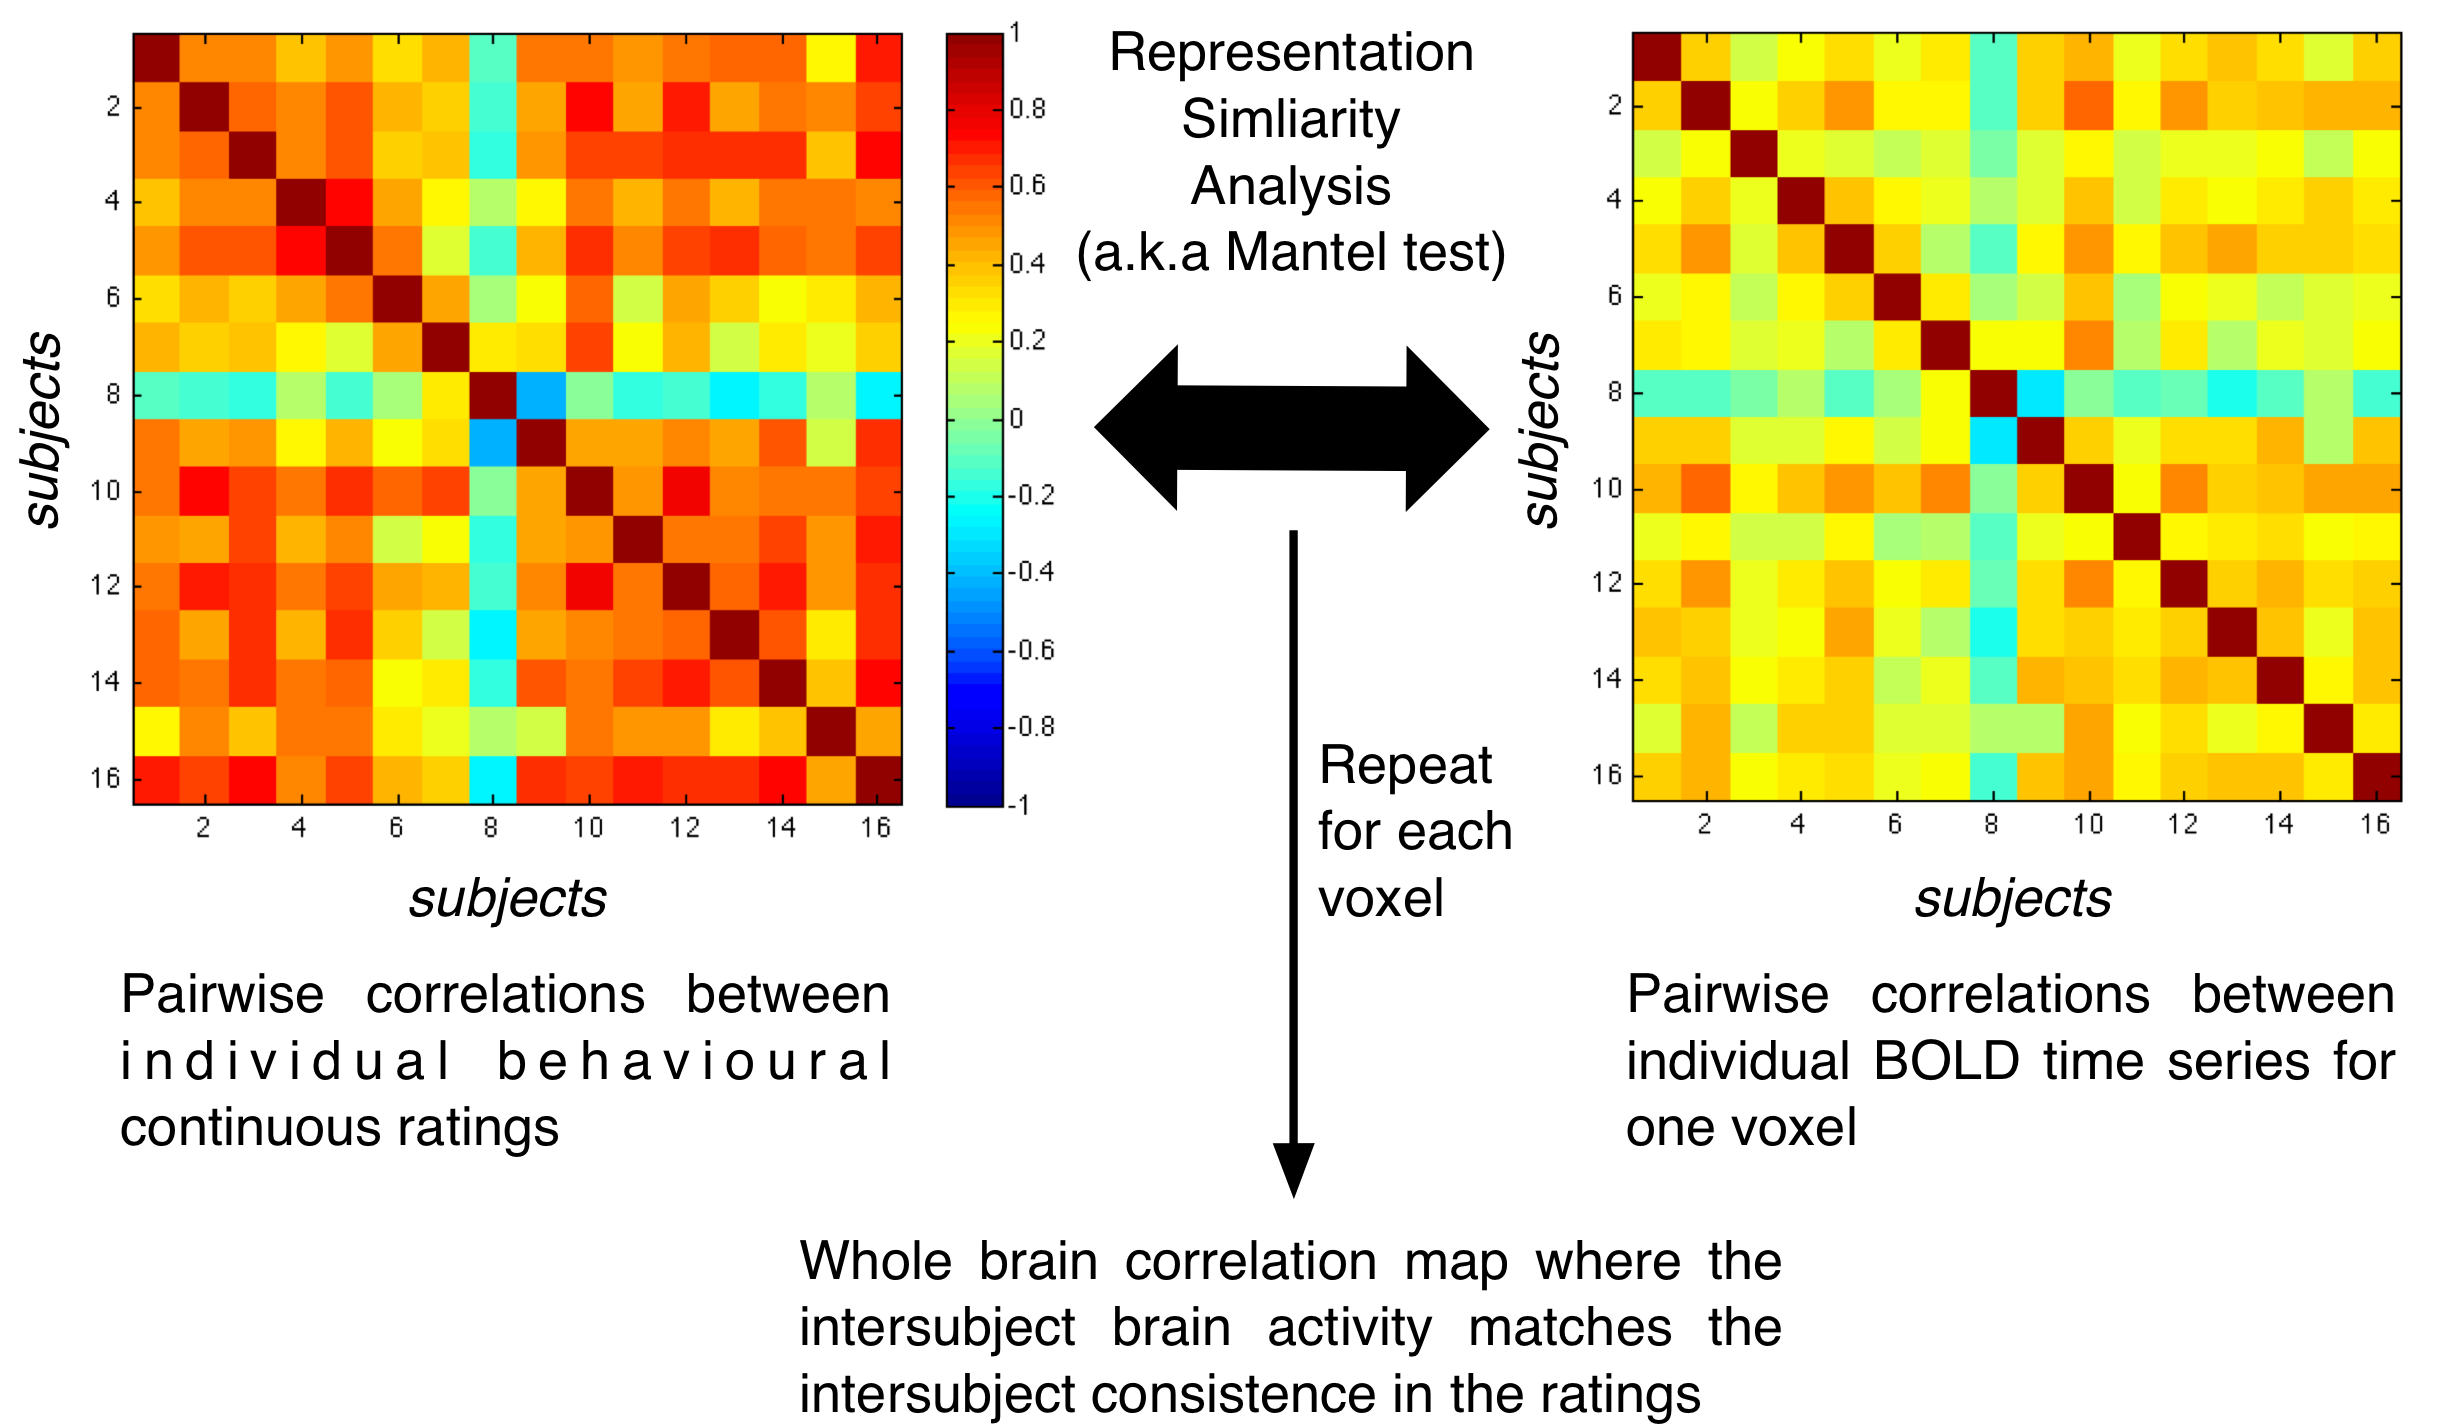
In the figure: Illustrating the method to relate inter-subject similarity of behavioural data with inter-subject correlation of BOLD time series. See Nummenmaa et al 2012, PNAS figure S2 for results.
For each voxel, firstly we compute the inter-subject correlation matrix from each subject BOLD signal using the Inter-Subject Correlation Toolbox. We then compare this subject-wise similarity matrix with another similarity matrix obtained by using behavioural data. As explained in the RSA paper, two similarity matrices can be compared by comparing the elements in the top triangle using Spearman correlation (i.e. we allow a monotonous relationship between the cell of the two matrices, not necessarily a linear one). In the Matlab demo code here below, I show how to do this with the ISC toolbox. Since the elements of a similarity matrix are not independent, parametric methods to assess the significance cannot be used. The most simple way is to shuffle the rows and columns of the model matrix. We do that independently for each voxel and then we approximate the surrogate null distribution using the ksdensity function in Matlab. This allows to compute the p-value of significance for each voxel. For details see the original paper Mantel 1967 or any multivariate analysis book for ecology or cancer research where the method is used more frequently than in neuroscience.
If you use this method or part of the code linked below, please cite:
Nummenmaa, L., Glerean, E., Viinikainen, M., Jaaskelainen, I. P., Hari, R., & Sams, M. (2012).
Emotions promote social interaction by synchronizing brain activity across individuals.
Proceedings of the National Academy of Sciences, 109(24), 9599–604. doi:10.1073/pnas.1206095109
Demo code:
isc_rsa_demo.m (06.03.2014)
From the demo code:
%% DEMO file to compute statistics between a voxel inter-subject correlation matrix
% computed with the ISC toolbox with option "PublicParams.calcCorMatrices = 1;" (i.e. save
% full correlation matrices) and a "model" inter-subject matrix computed with corr/pdist
% from behavioural individual data.
%
% This analysis is also called Mantel test: see bramila_mantel.m for a reusable function
% with code similar to the below.
%
% If you use this analysis please cite:
%
% Nummenmaa, L., Glerean, E., Viinikainen, M., Jaaskelainen, I. P., Hari, R., & Sams, M.
% (2012). Emotions promote social interaction by synchronizing brain activity across
% individuals. Proceedings of the National Academy of Sciences, 109(24), 9599–604.
% doi:10.1073/pnas.1206095109
%
% (c) Enrico Glerean 2013 - Brain and Mind Laboratory Aalto University http://becs.aalto.fi/bml/
Comparing two groups with permutations
This is a simple equivalent of the ttest2 function in MATLAB, with the difference that the p-values are estimated through permutation tests. Multiple values are passed for each subject (e.g. voxels intensities for fMRI data or node properties for a network - e.g. node strength). Each datapoint is tested across the two groups of subjects (or conditions) by estimating the null distribution via labels permutations. There is a demo script that shows how to use the function and how to correct for multiple comparisons.
Code:
    bramila_ttest2_np.m (13.01.2014)
    bramila_ttest2_np_example.m (demo, 13.01.2014)
If you find this function useful, please cite:
Glerean, E., Pan, R.K., Salmi, J., Kujala, R., Lahnakoski, J.M., Roine, U., Nummenmaa, L., Leppämäki, S., Nieminen-von Wendt, T., Tani, P., Saramäki, J., Sams, M., Jääskeläinen, I.P. (in press) Reorganization of functionally connected brain subnetworks in high-functioning autism Human Brain Mapping. doi:10.1002/hbm.23084
From the function help:
% BRAMILA_TTEST2_NP - A "non parametric" two-sample T-test that, instead of
% relying on the t-distribtion, uses permutations of group labels to
% estimate the null distribution. The null distribution is computed
% independently for each data point (= row), i.e. we do not assume the same
% distribution for each datapoint. However, we do assume that the data
% points are comparable (e.g. they correspond to the same location
% collected across all subjects)
%
%   - Usage:
%   stats = bramila_ttest2_np(data,design,niter)
%   - Input:
%   data = a matrix where each column is a subject and each row is a
%       data-point for example a voxel intensity in fMRI, a node level
%       value in a network, etc. NaN values will be ignored.
%   design = a row vector containing the numbers 1 and 2 for the two groups
%   niter = number of permutations (recommended 5000)
%
%   - Output:
%   stats = a struct with the subfields
%       pvals = p-values for each datapoint; it returns in order the p-values
%       for the right tail and for the left tail
%       tvals = T-values for datapoint, positive tvals mean group 1 > group 2
%
% Notes: the null distribution is estimated using the matlab function
% ksdensity by interpolating the permuted data. The distribution is
% estimated over 200 points if niter<=5000, otherwise it is estimated over
% round(200*niter/5000) points, for greater precision.